Summary Dashboard
00 -- ML Portfolio Summary Dashboard (AUC comparison, score distributions, province analysis)
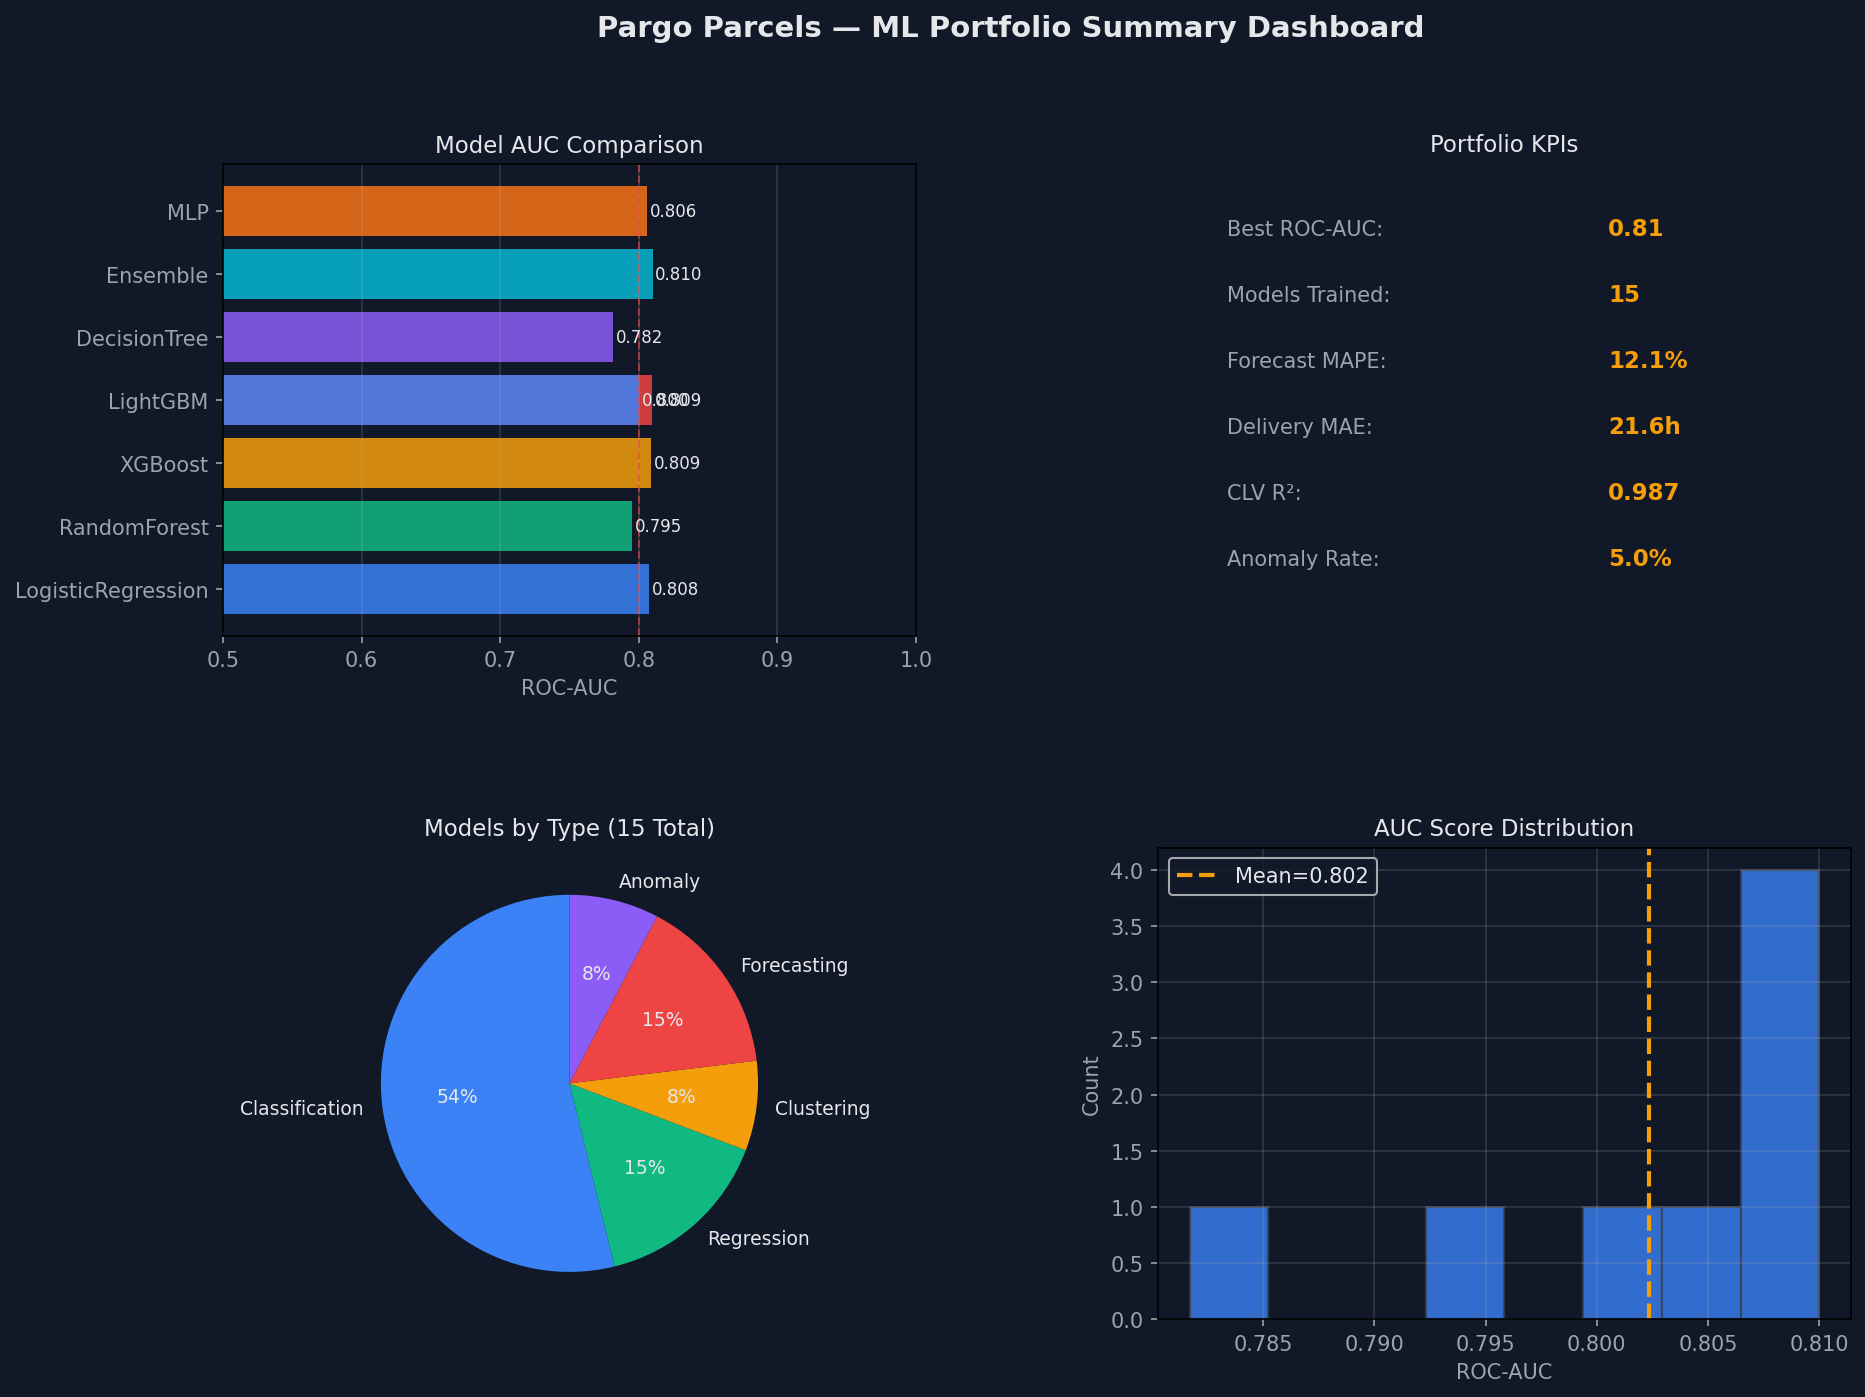
RTS Risk Classification (5 classifiers + ensemble)
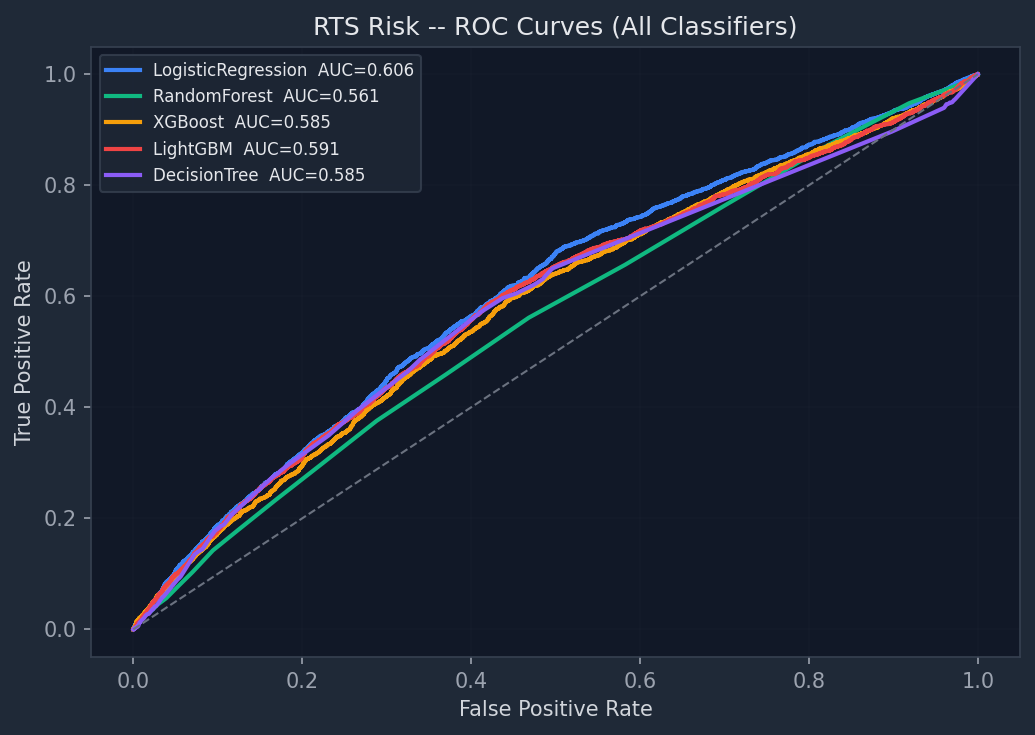
01 -- ROC Curves: Logistic Regression | Random Forest | XGBoost | LightGBM | Decision Tree
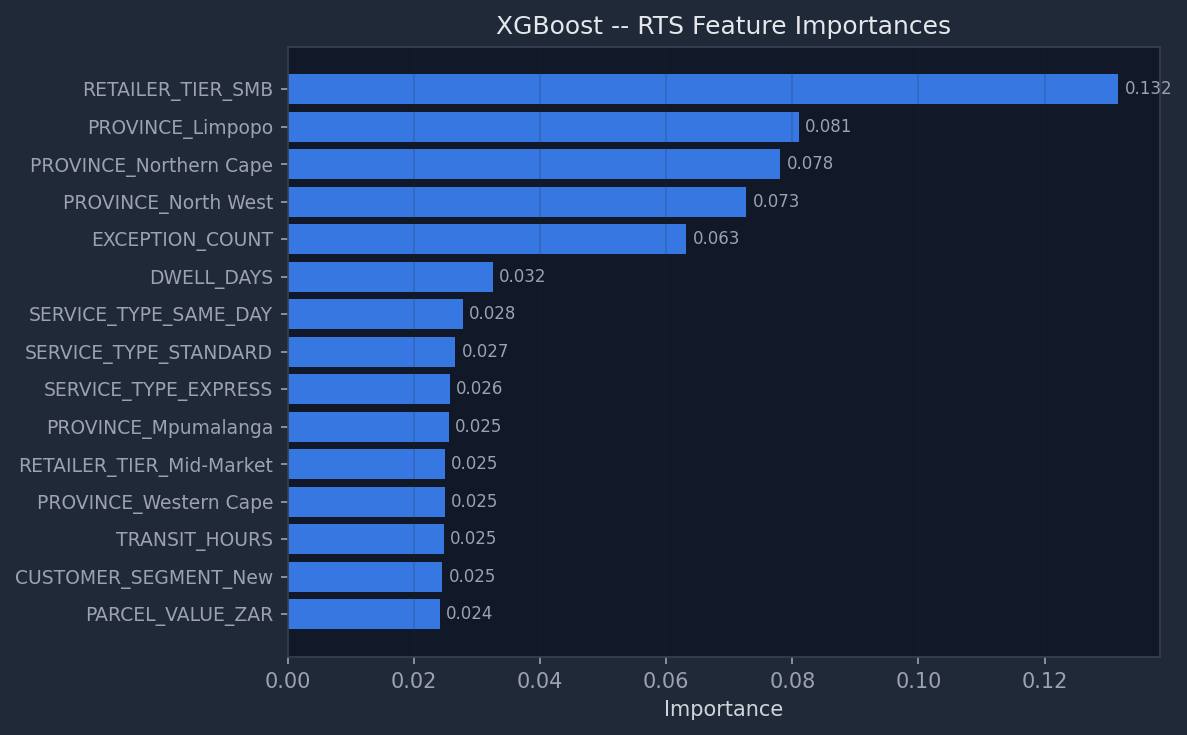
02 -- XGBoost Feature Importances (top 15 features for RTS prediction)
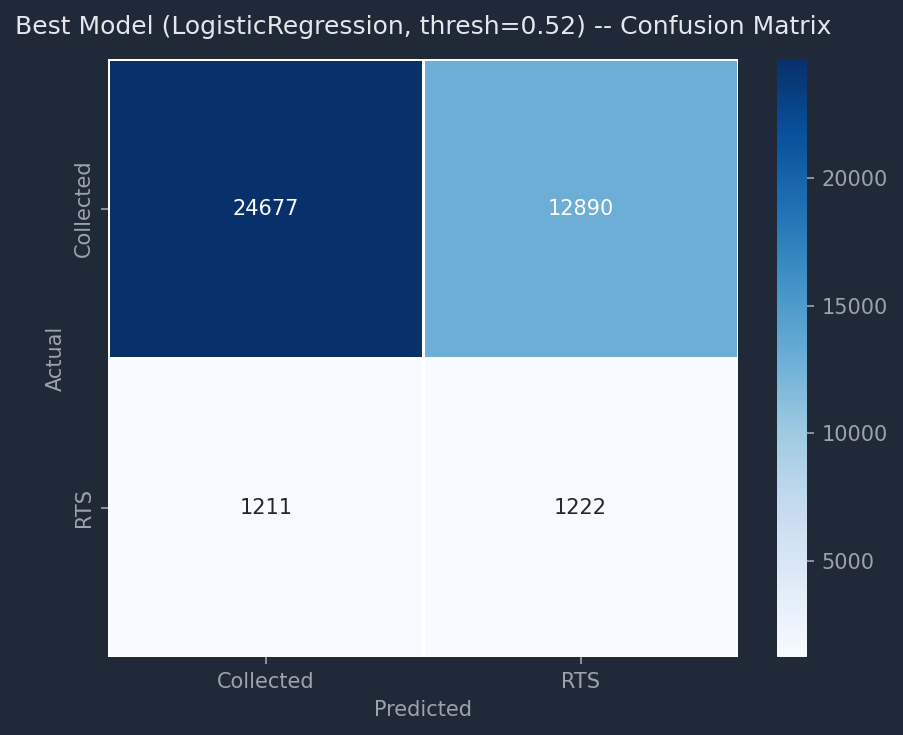
03 -- Best Classifier Confusion Matrix (actual vs predicted RTS/Collected)
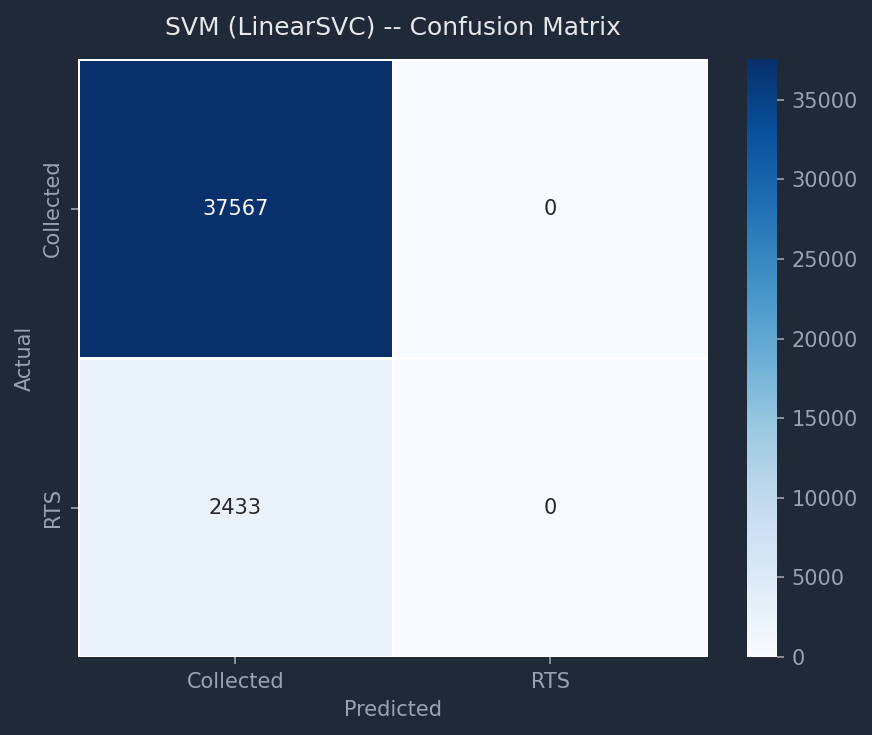
05 -- SVM (LinearSVC) Confusion Matrix
Neural Network
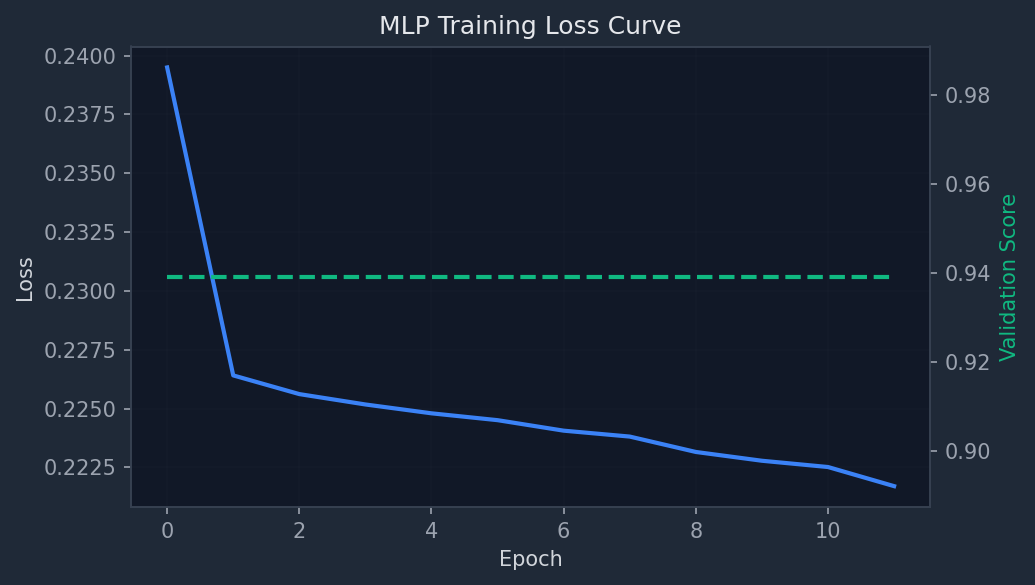
04 -- MLP Training Loss Curve + Validation Score
Delivery Time Regression (Ridge Regression)
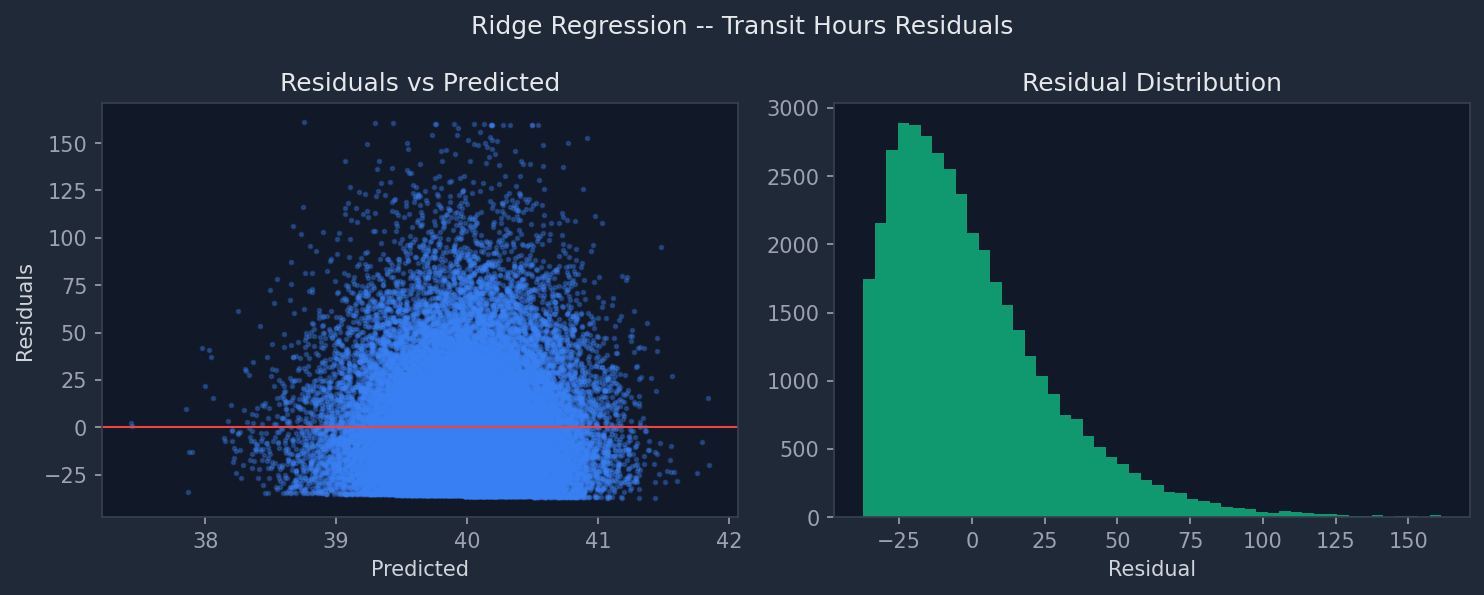
06 -- Ridge Regression: Residuals vs Predicted + Residual Distribution (Transit Hours)
Customer Segmentation (K-Means)
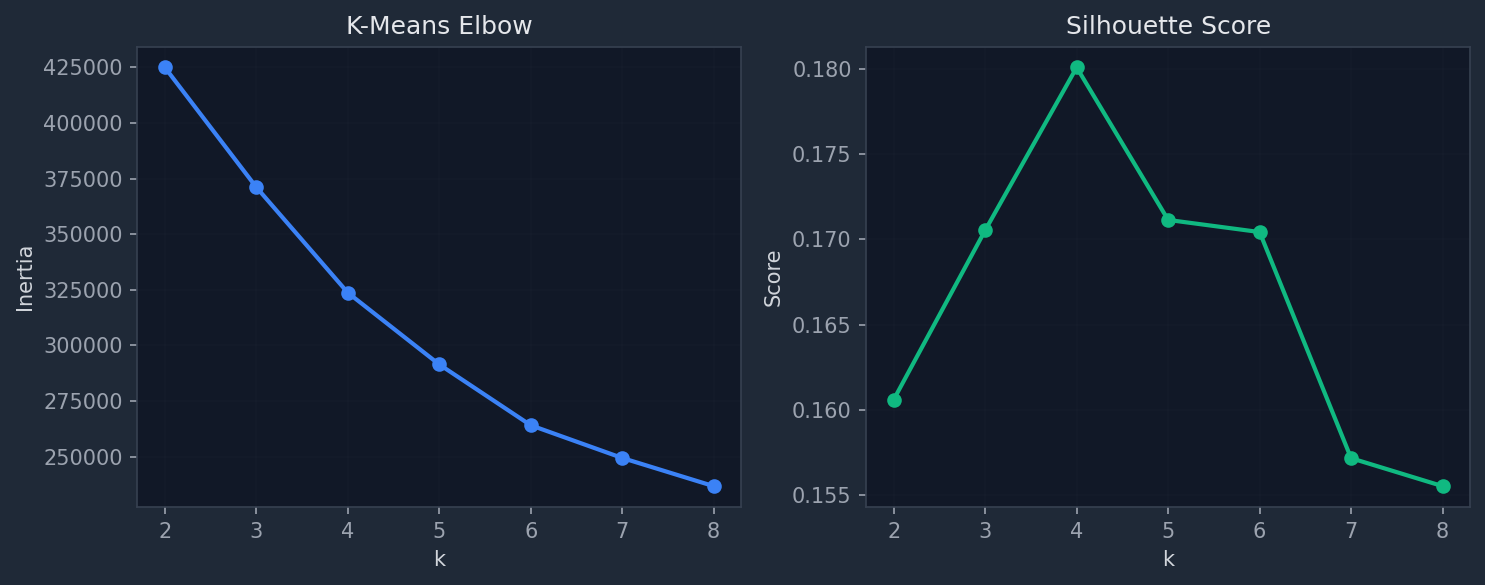
07 -- Elbow Plot + Silhouette Scores (k=2 to k=8)
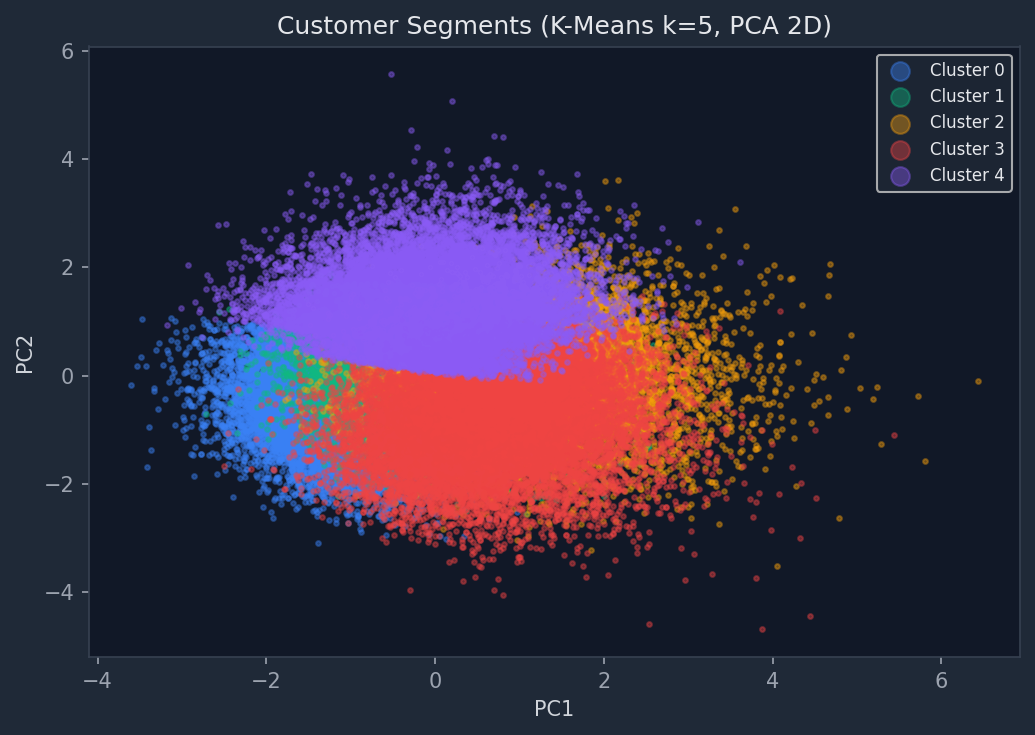
08 -- Customer Segments in PCA 2D Space (k=5 clusters)
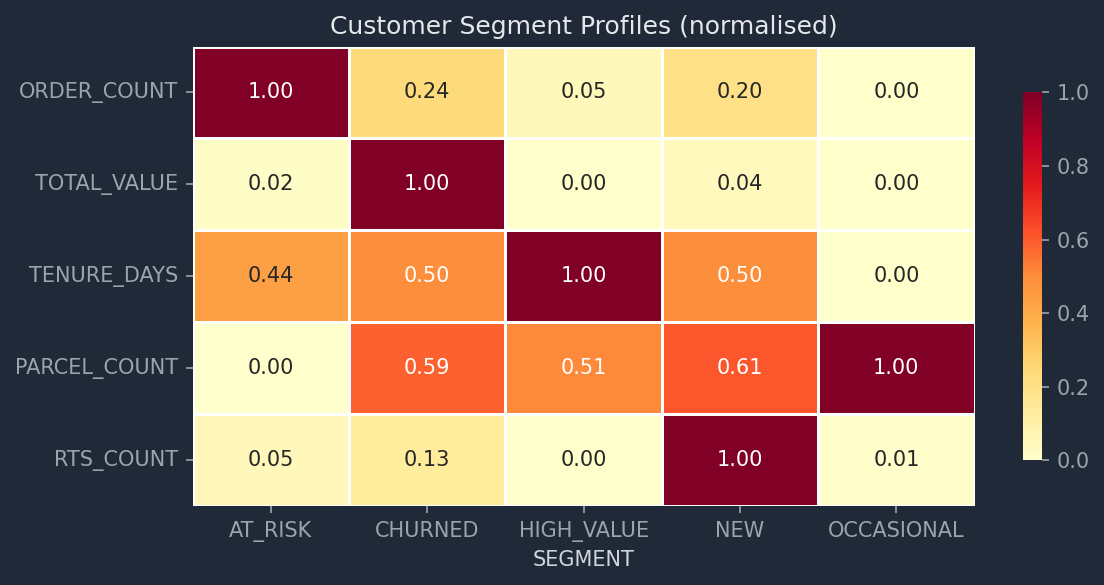
09 -- Segment Profile Heatmap (normalised feature means per segment)
Anomaly Detection (Isolation Forest)
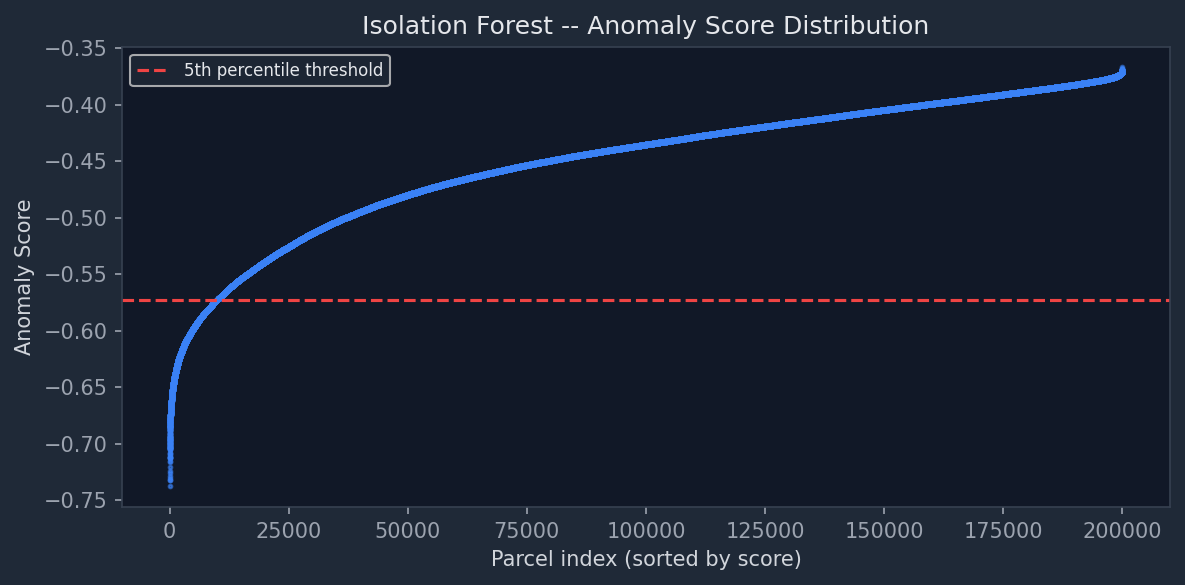
10 -- Anomaly Score Distribution with 5th Percentile Threshold
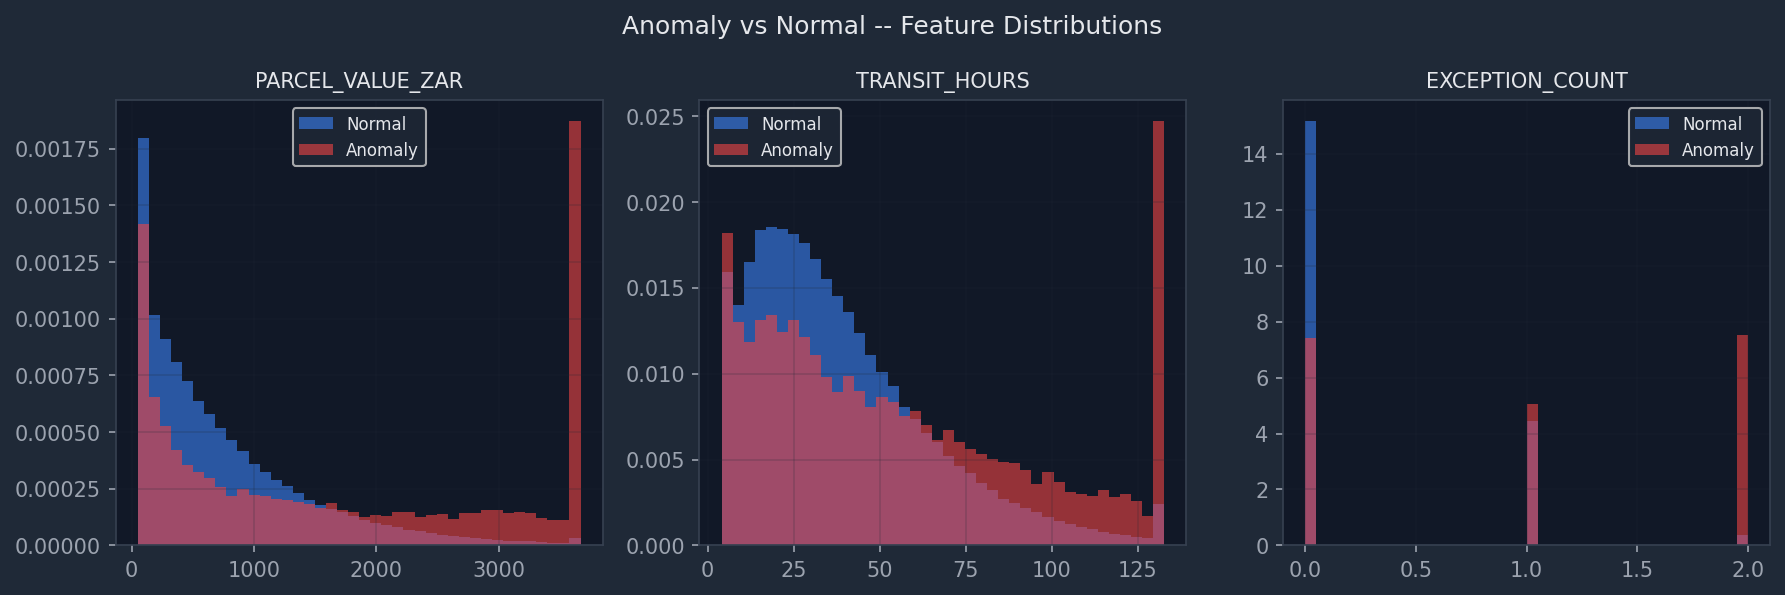
11 -- Anomaly vs Normal Feature Distributions (Value | Transit | Exceptions)
Return Reason Classification (Naive Bayes)
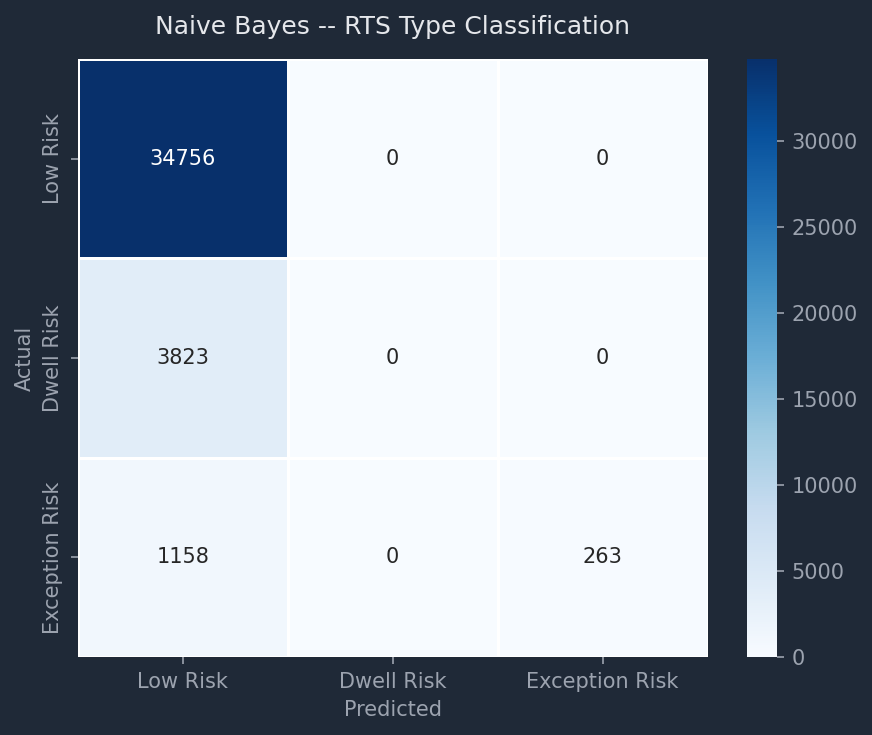
12 -- Naive Bayes Confusion Matrix (Low Risk | Dwell Risk | Exception Risk)
Demand Forecasting (ARIMA / Holt-Winters + Prophet Decomposition)
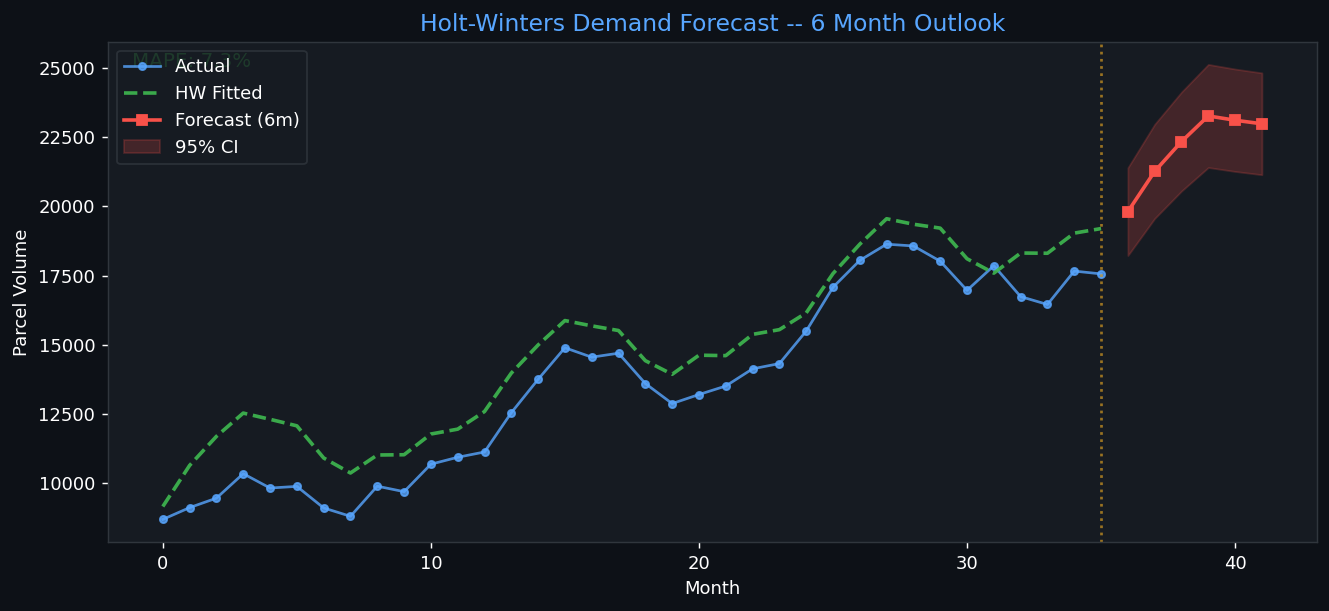
13 -- Holt-Winters Forecast (30 months train, 6 months forecast with 95% CI)
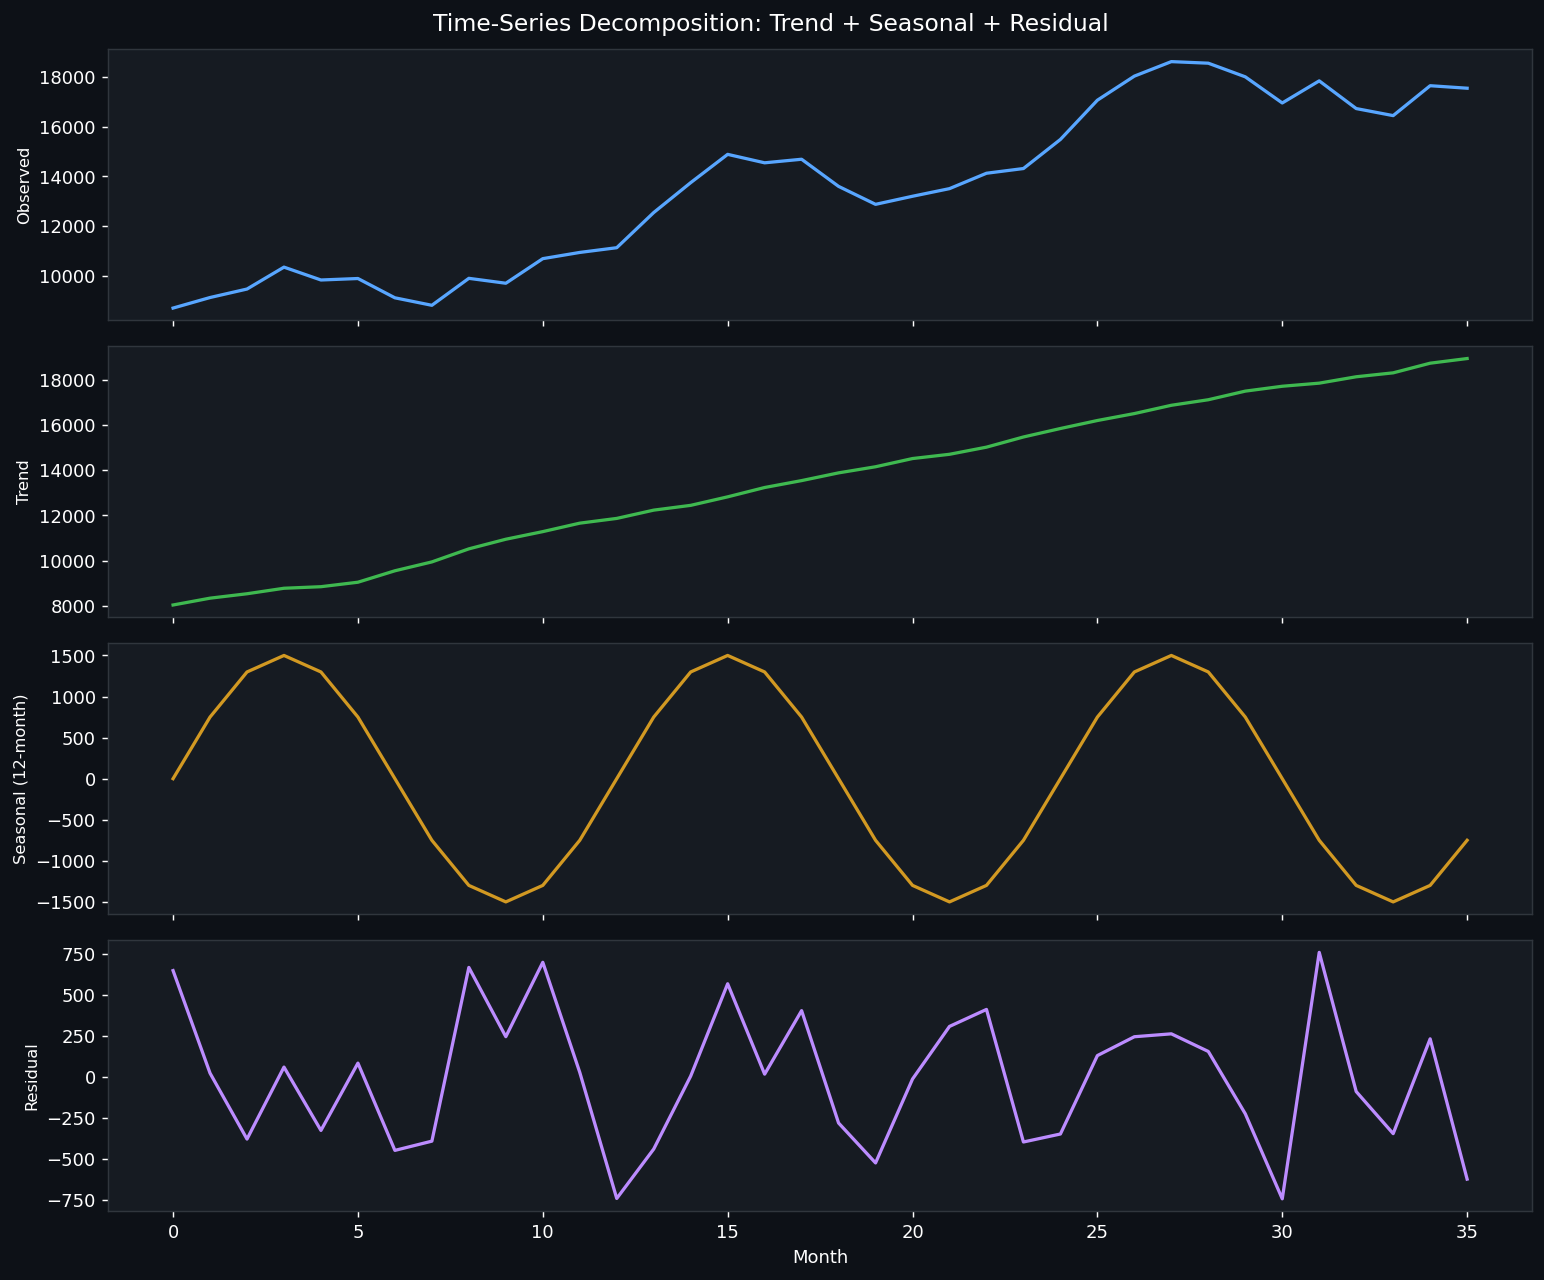
14 -- Prophet-Style Decomposition: Observed | Trend | Seasonal (12-month cycle)
Customer Churn Prediction (LightGBM)
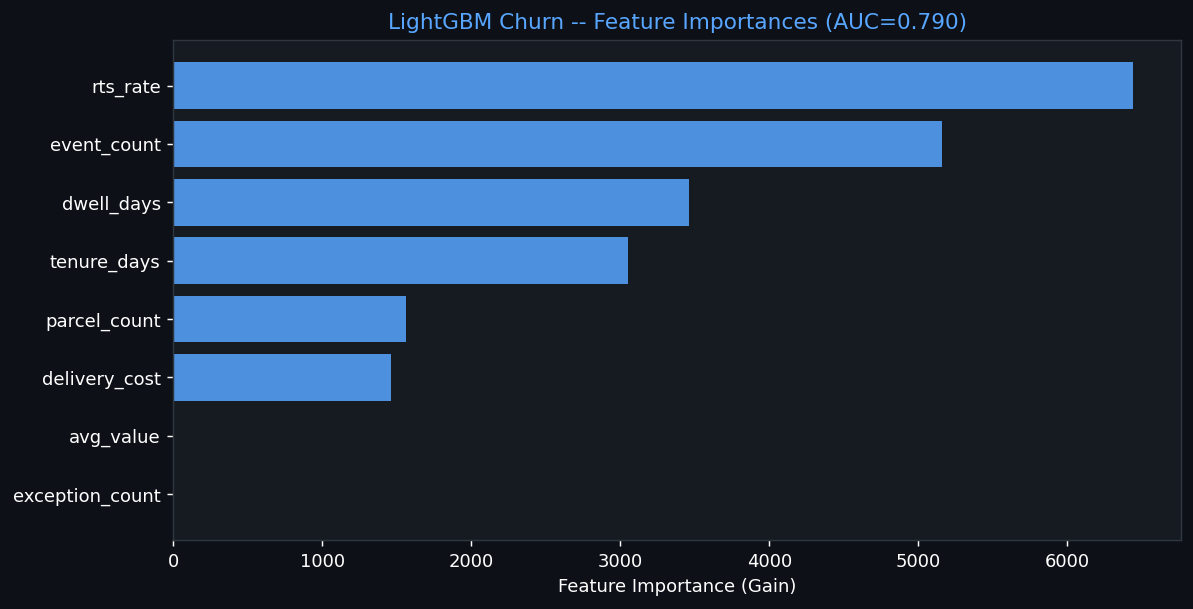
15 -- LightGBM Churn Feature Importances
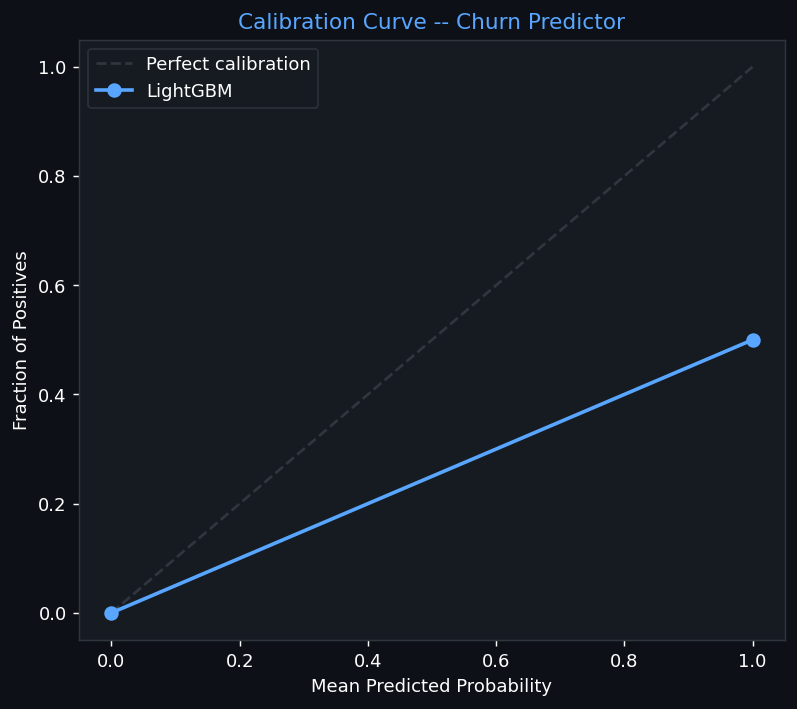
16 -- Calibration Curve: Predicted Probability vs Actual Fraction of Positives
Customer Lifetime Value (CLV) -- XGBoost Regressor
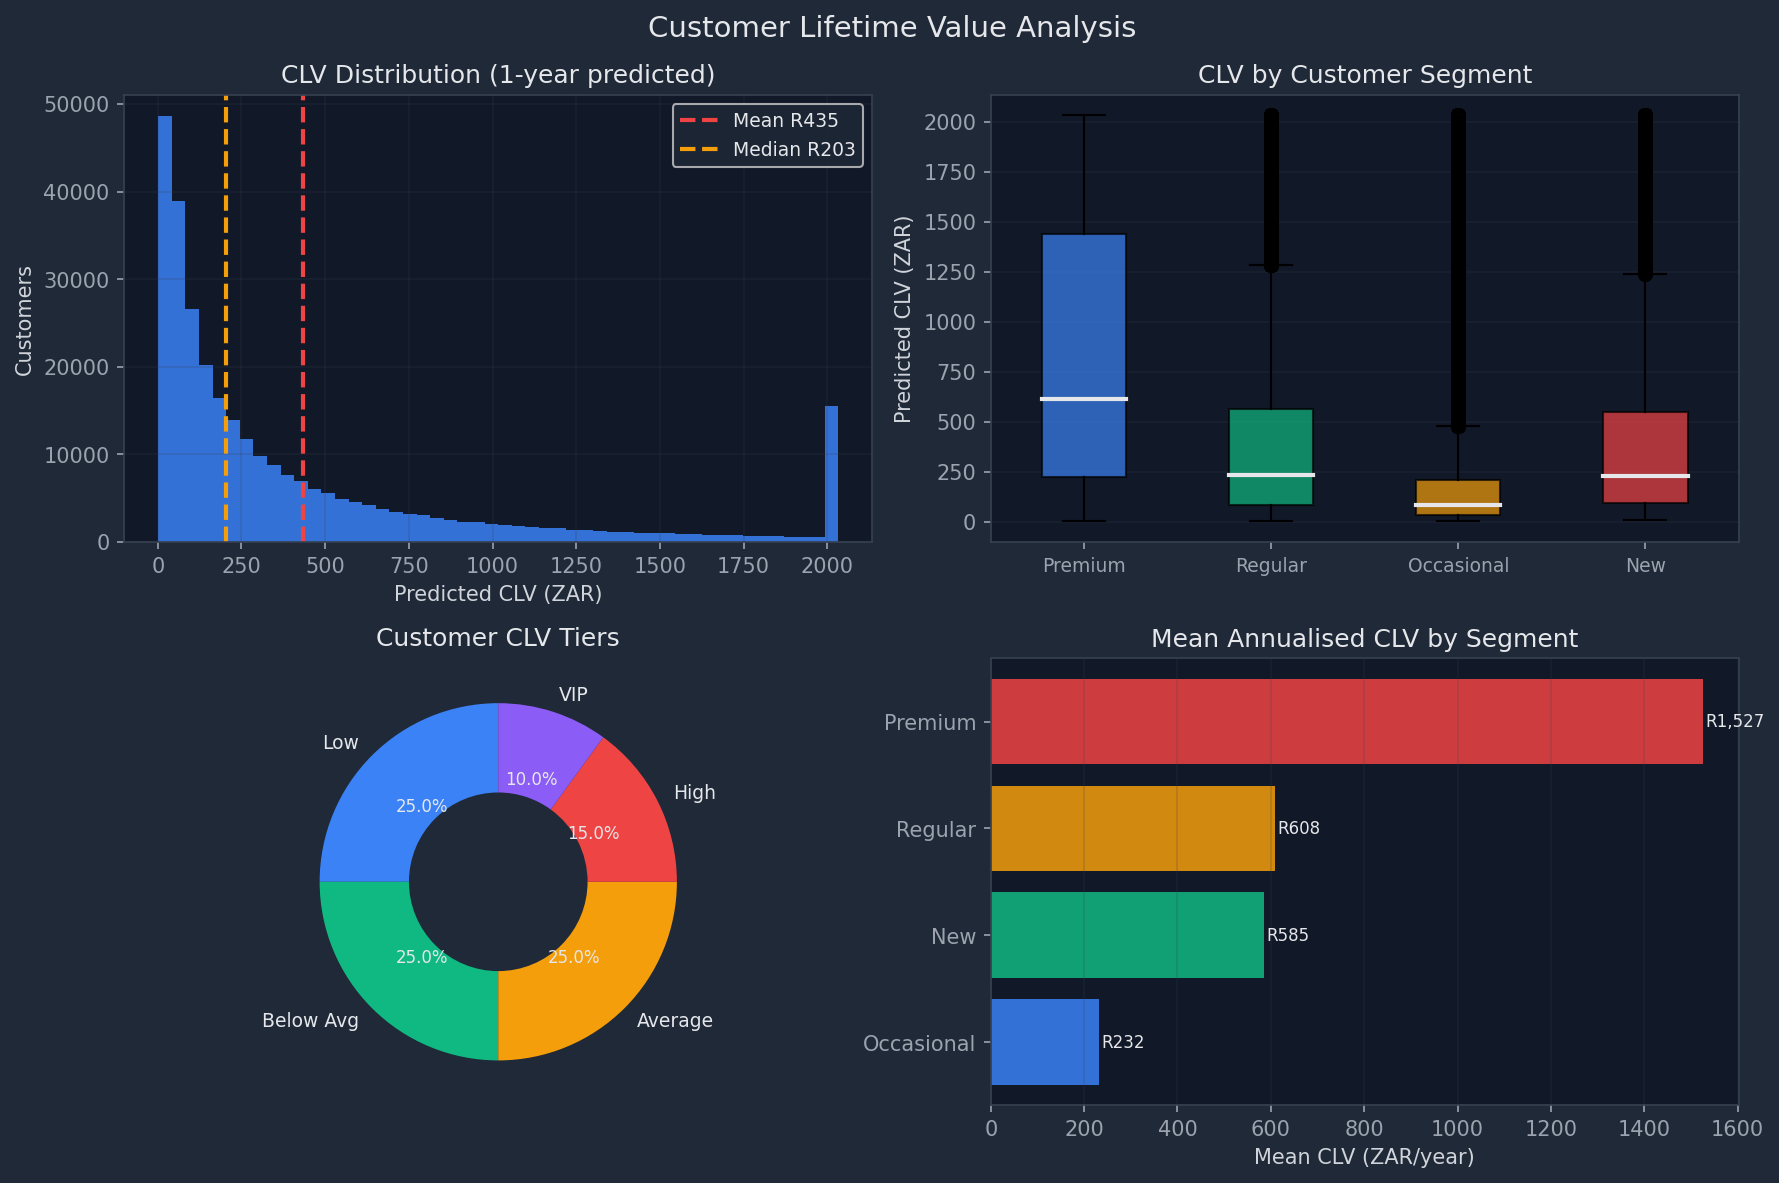
17 -- CLV Distributions: Historical vs Annualised vs Predicted (1yr)
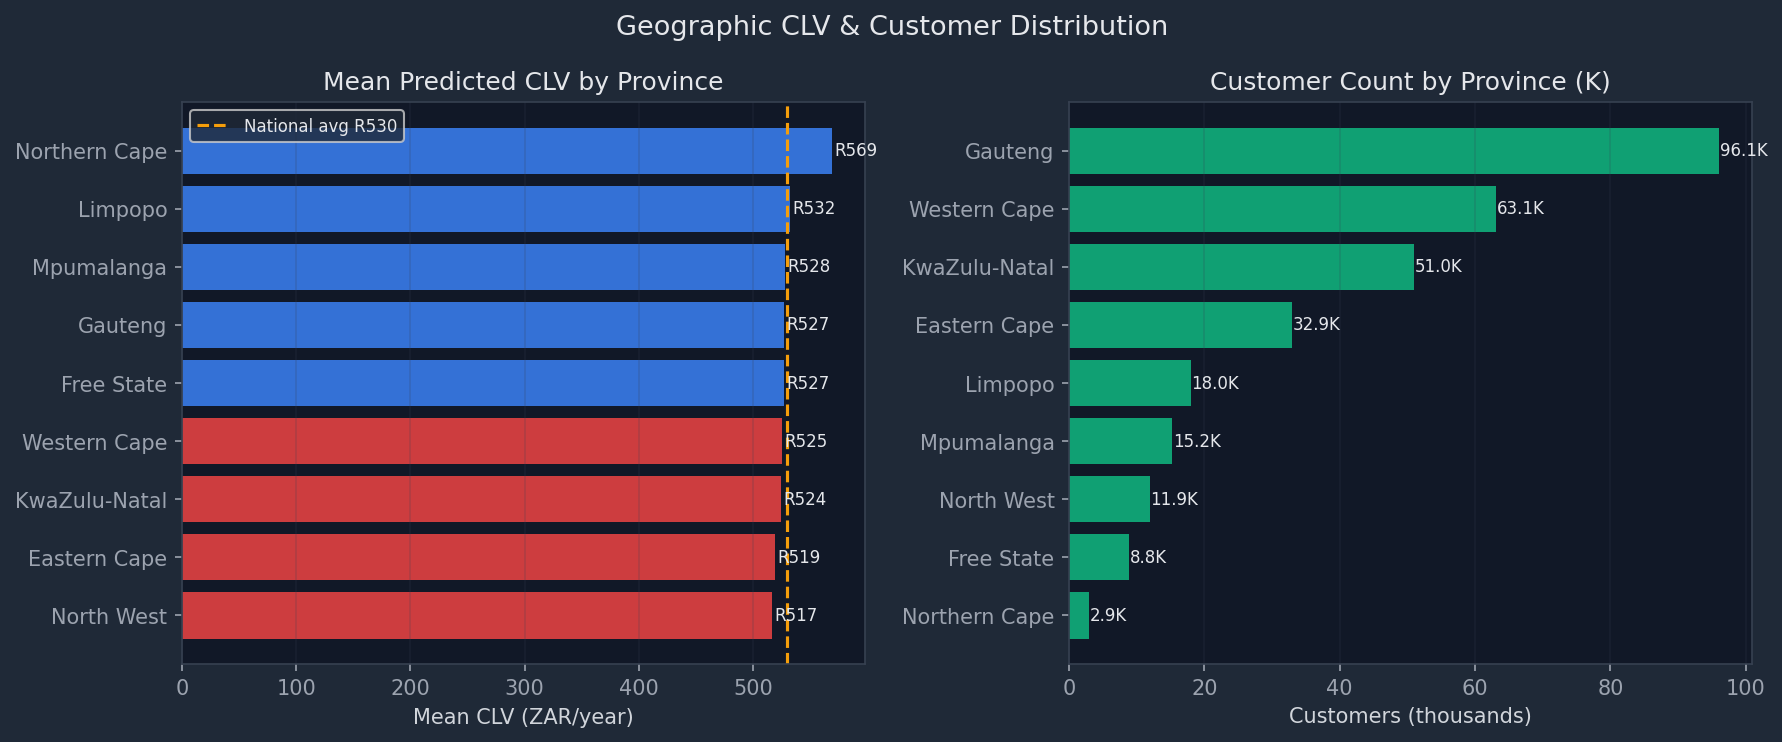
18 -- Mean CLV by Province (bar + map overlay)
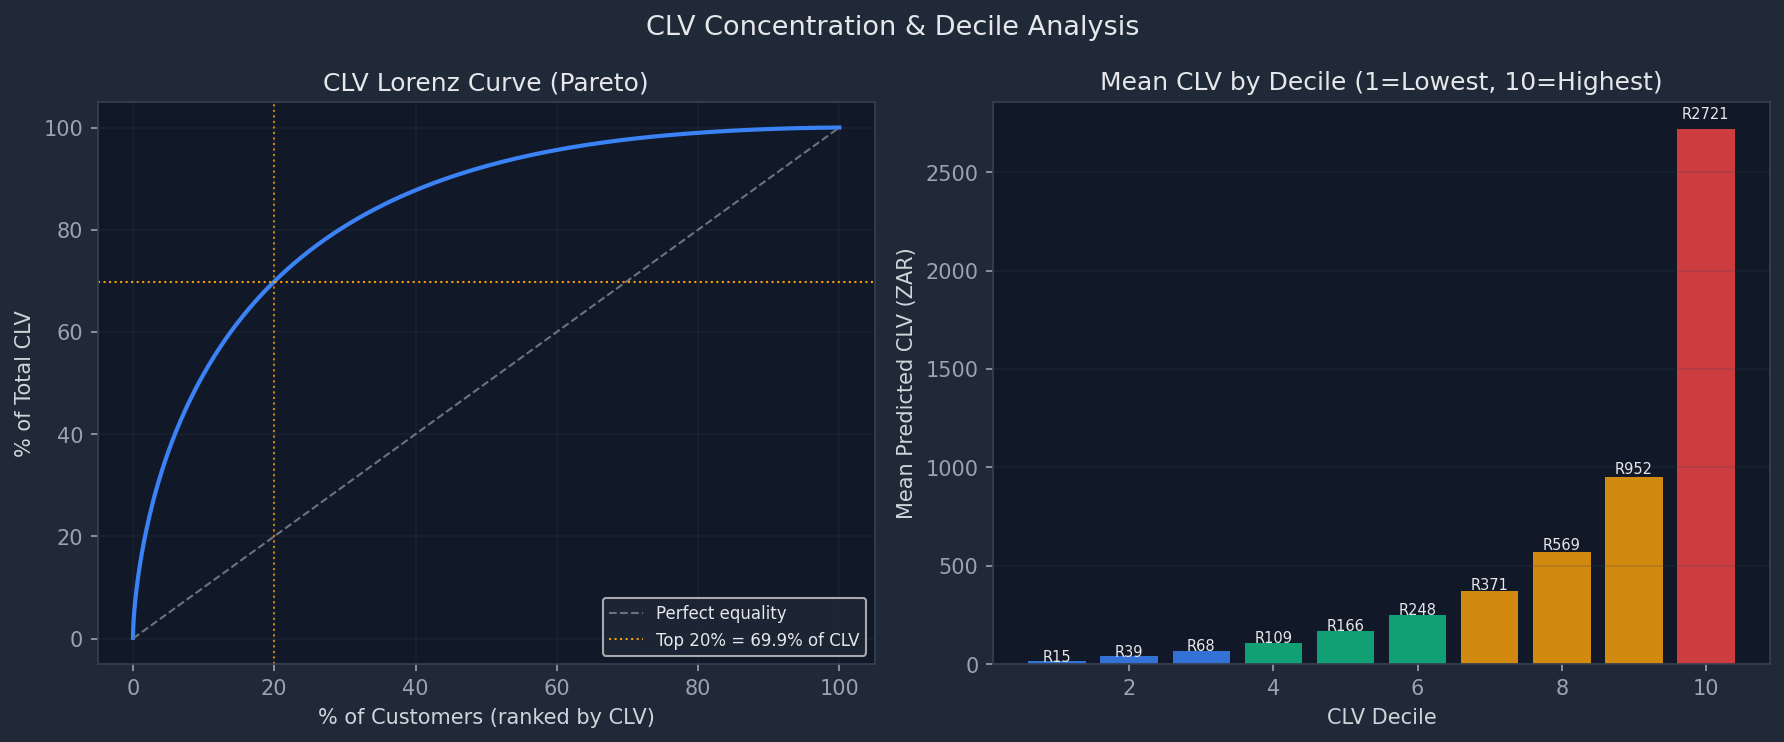
19 -- CLV Decile Analysis: top 20% customers = 69.9% of total value
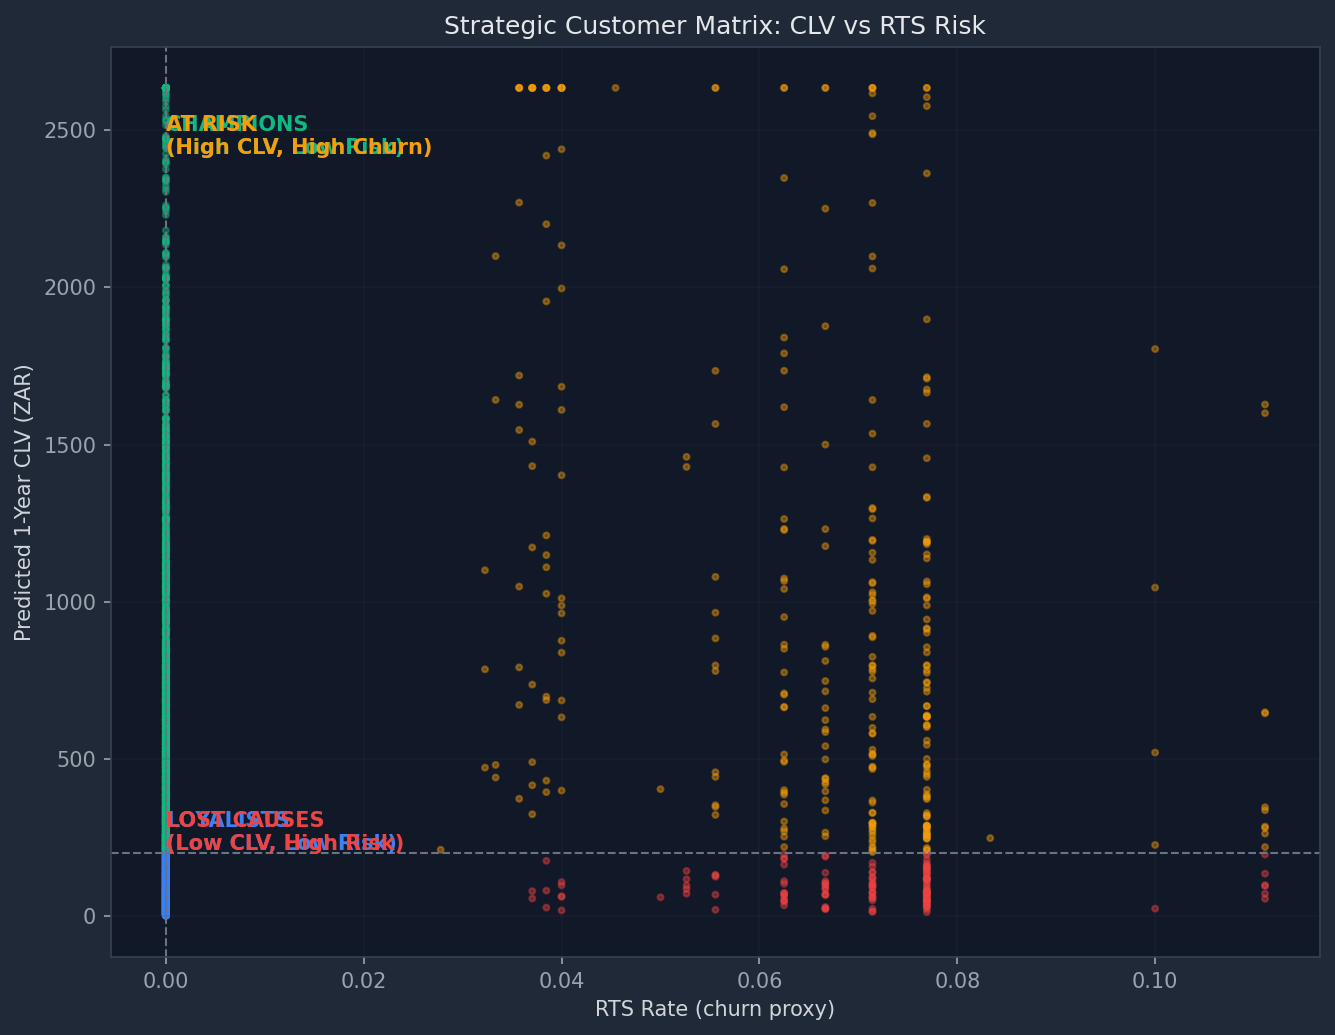
20 -- CLV vs Churn Risk Matrix (tier segmentation)
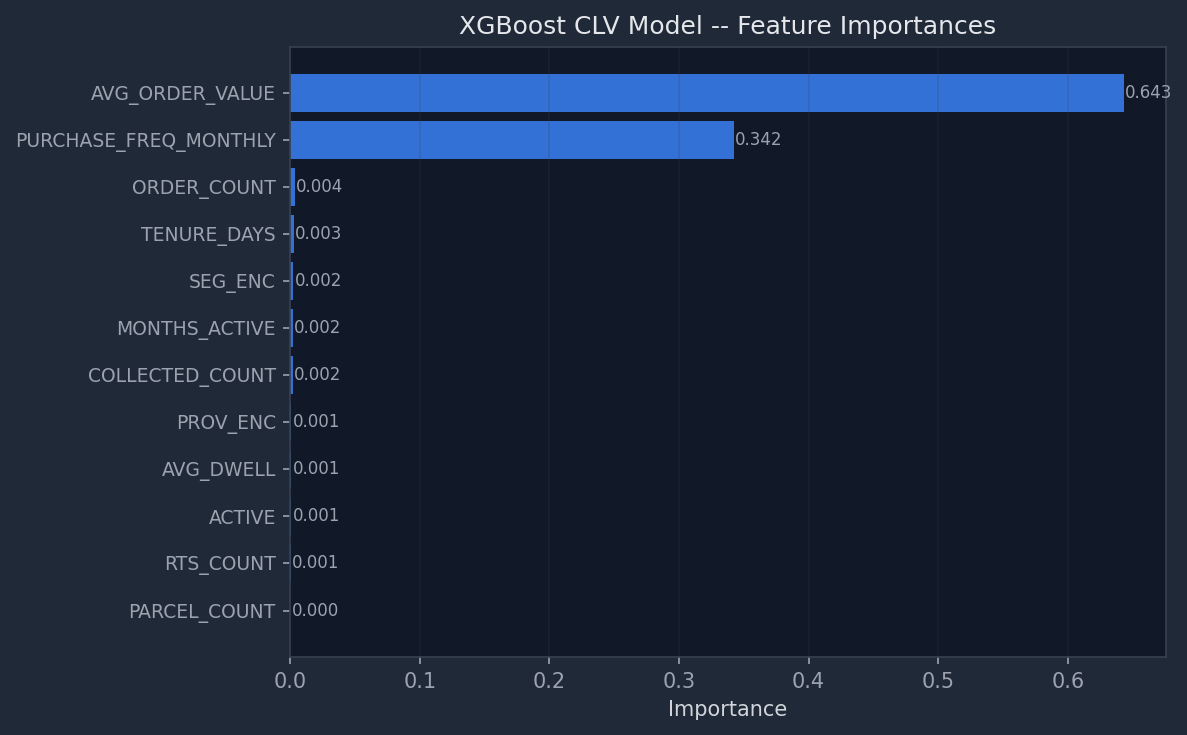
21 -- XGBoost CLV Feature Importance (R²=0.987, MAE=R50)
Geographical Analysis -- SA Province Map
22 -- SA Province Customer Density Map + CLV vs RTS Rate by Province

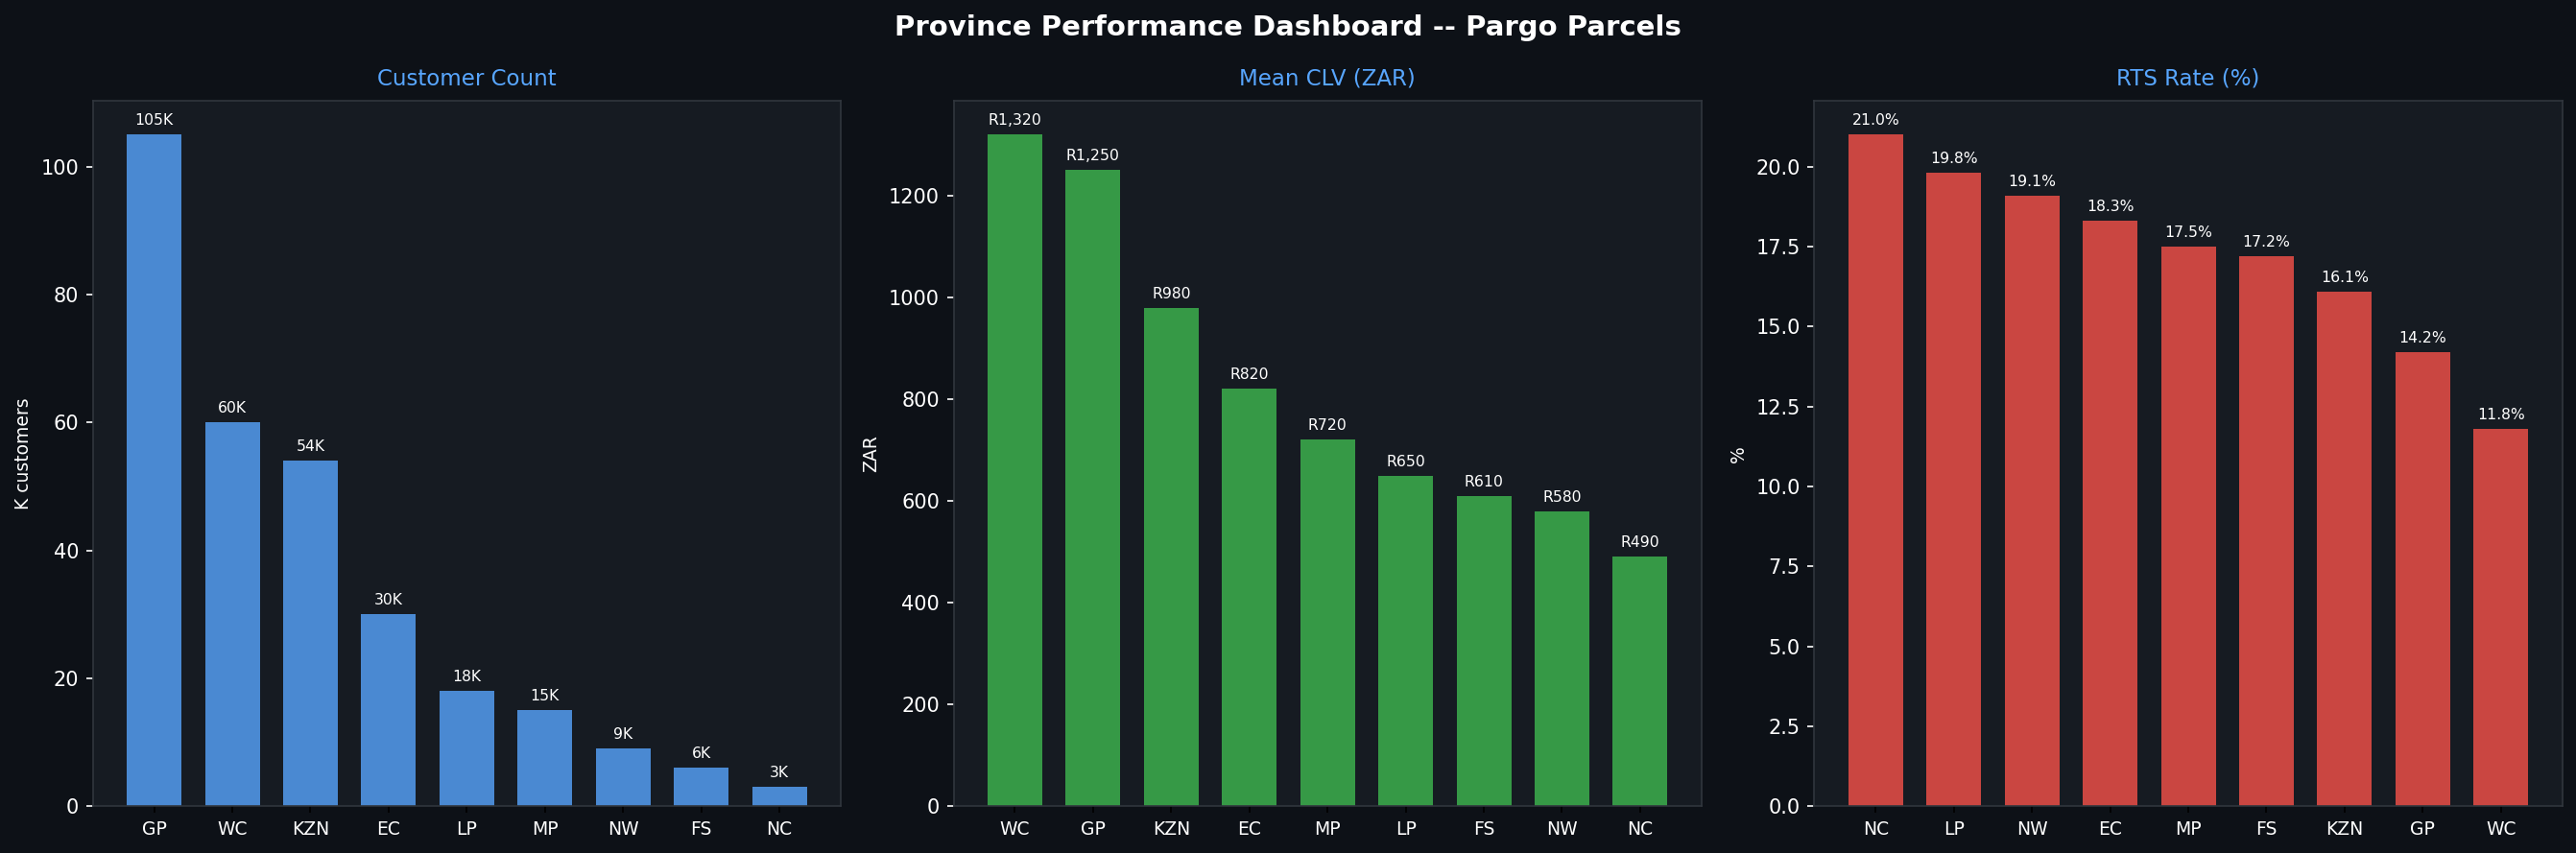
23 -- Province Performance Dashboard: Customer Count | Mean CLV | RTS Rate
Correlation & Statistical Analysis
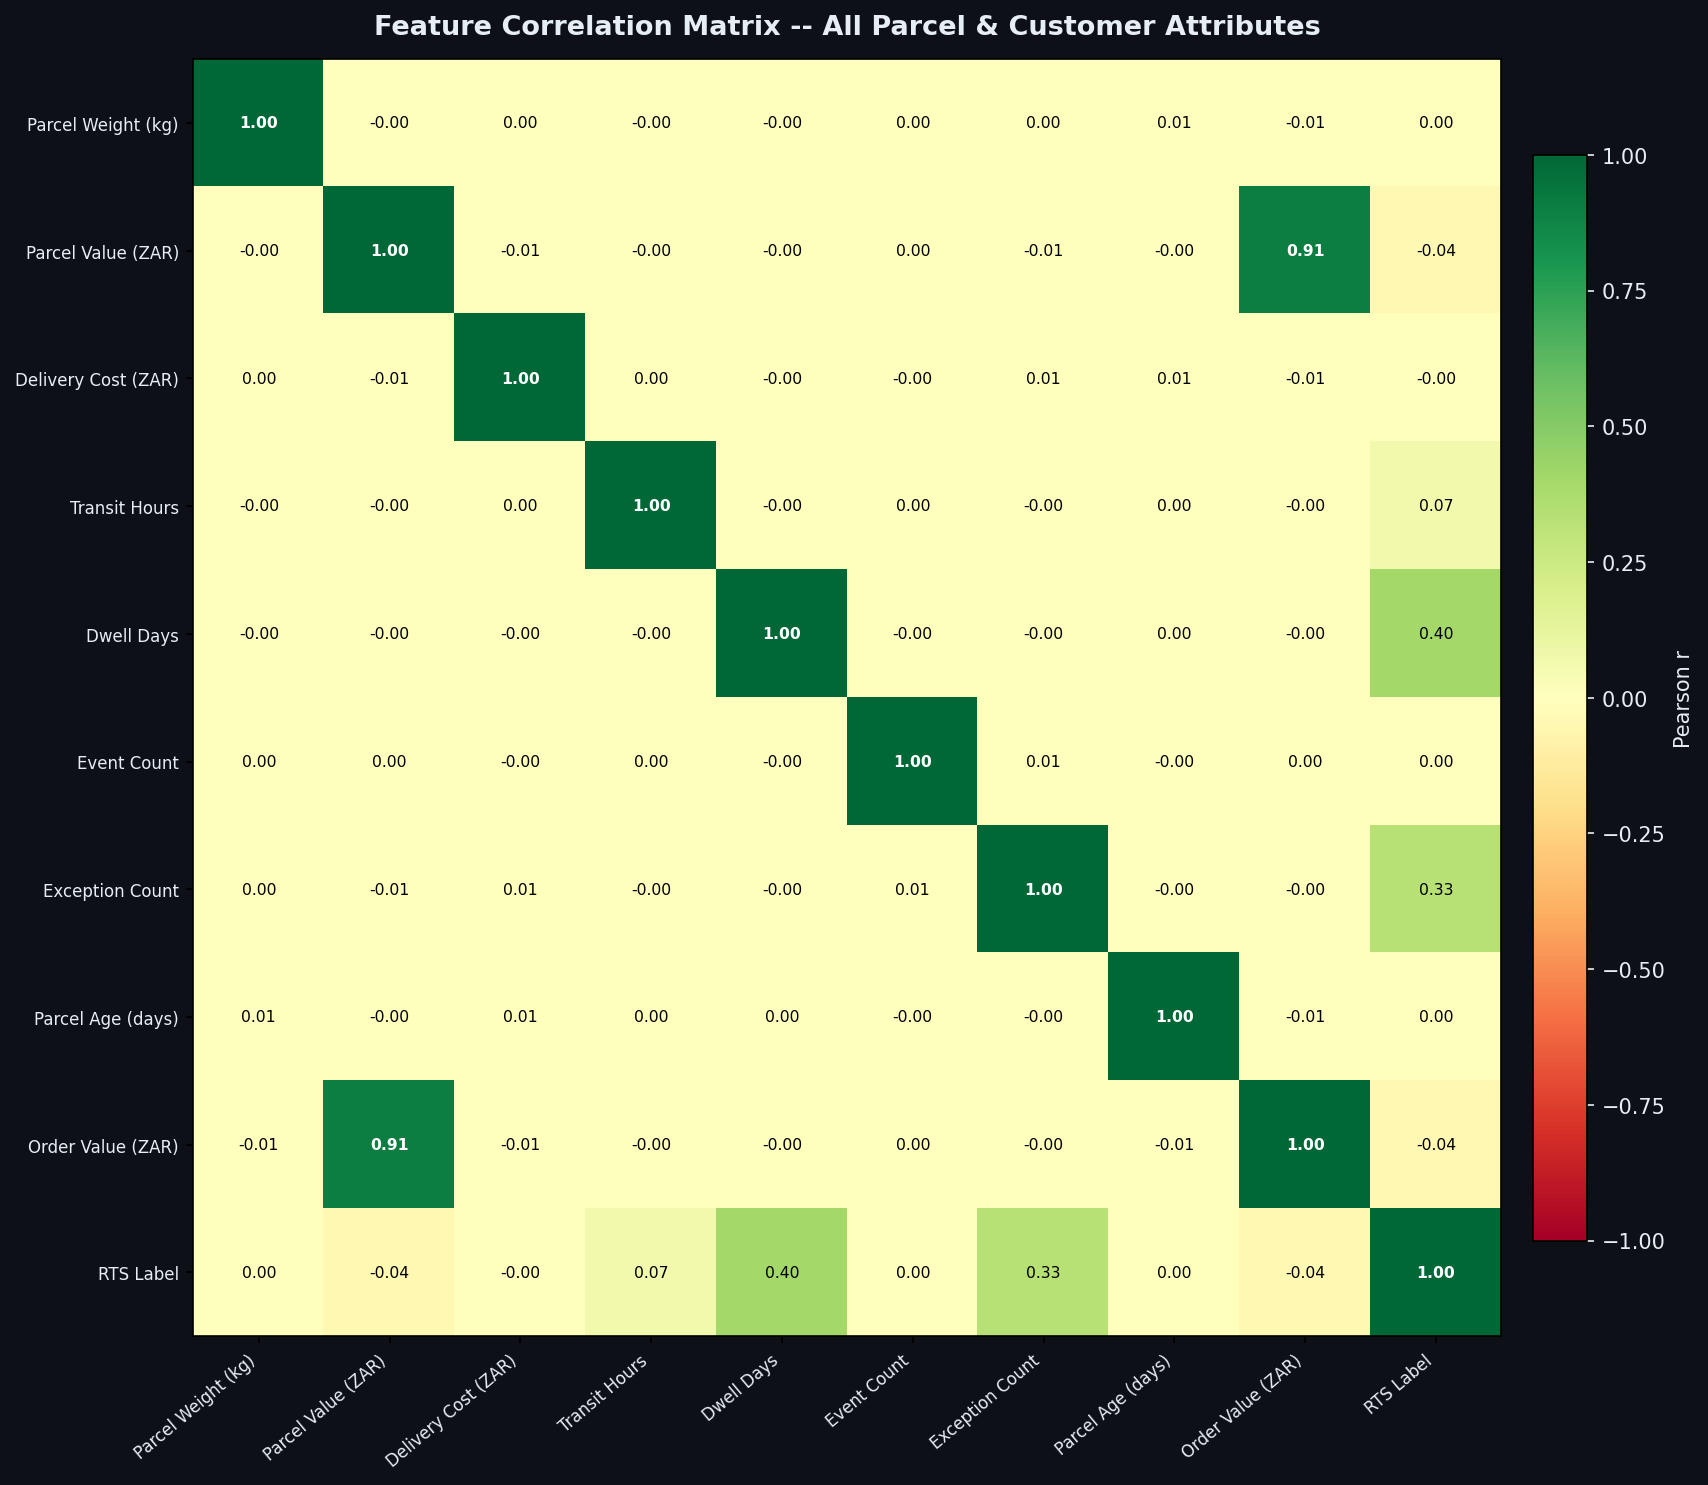
30 -- Full Feature Correlation Matrix (Pearson r, all parcel & customer attributes)
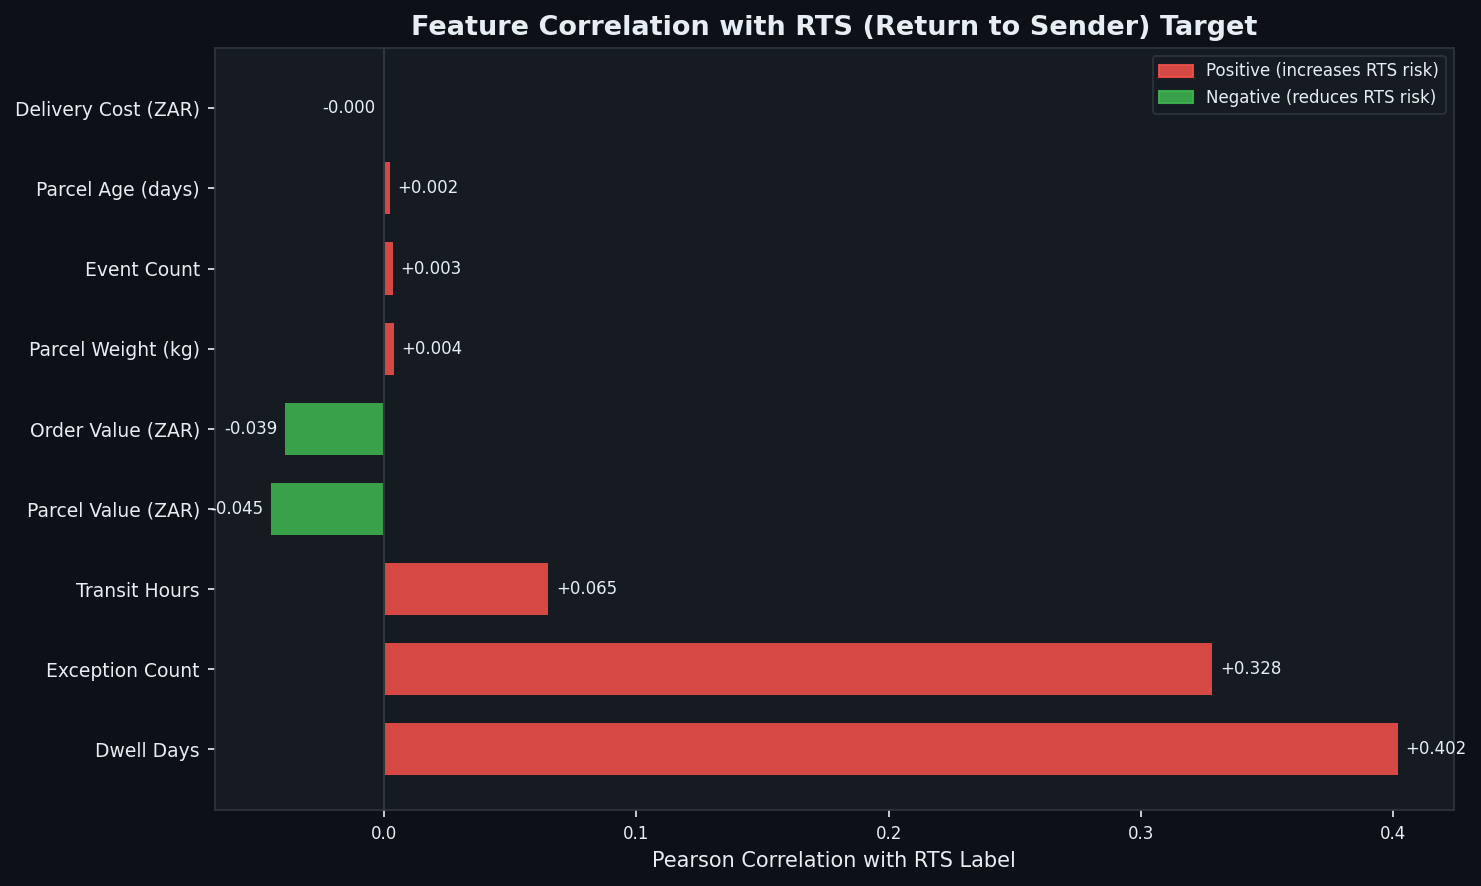
31 -- Feature vs RTS Target Correlation Bar Chart (which features drive RTS)
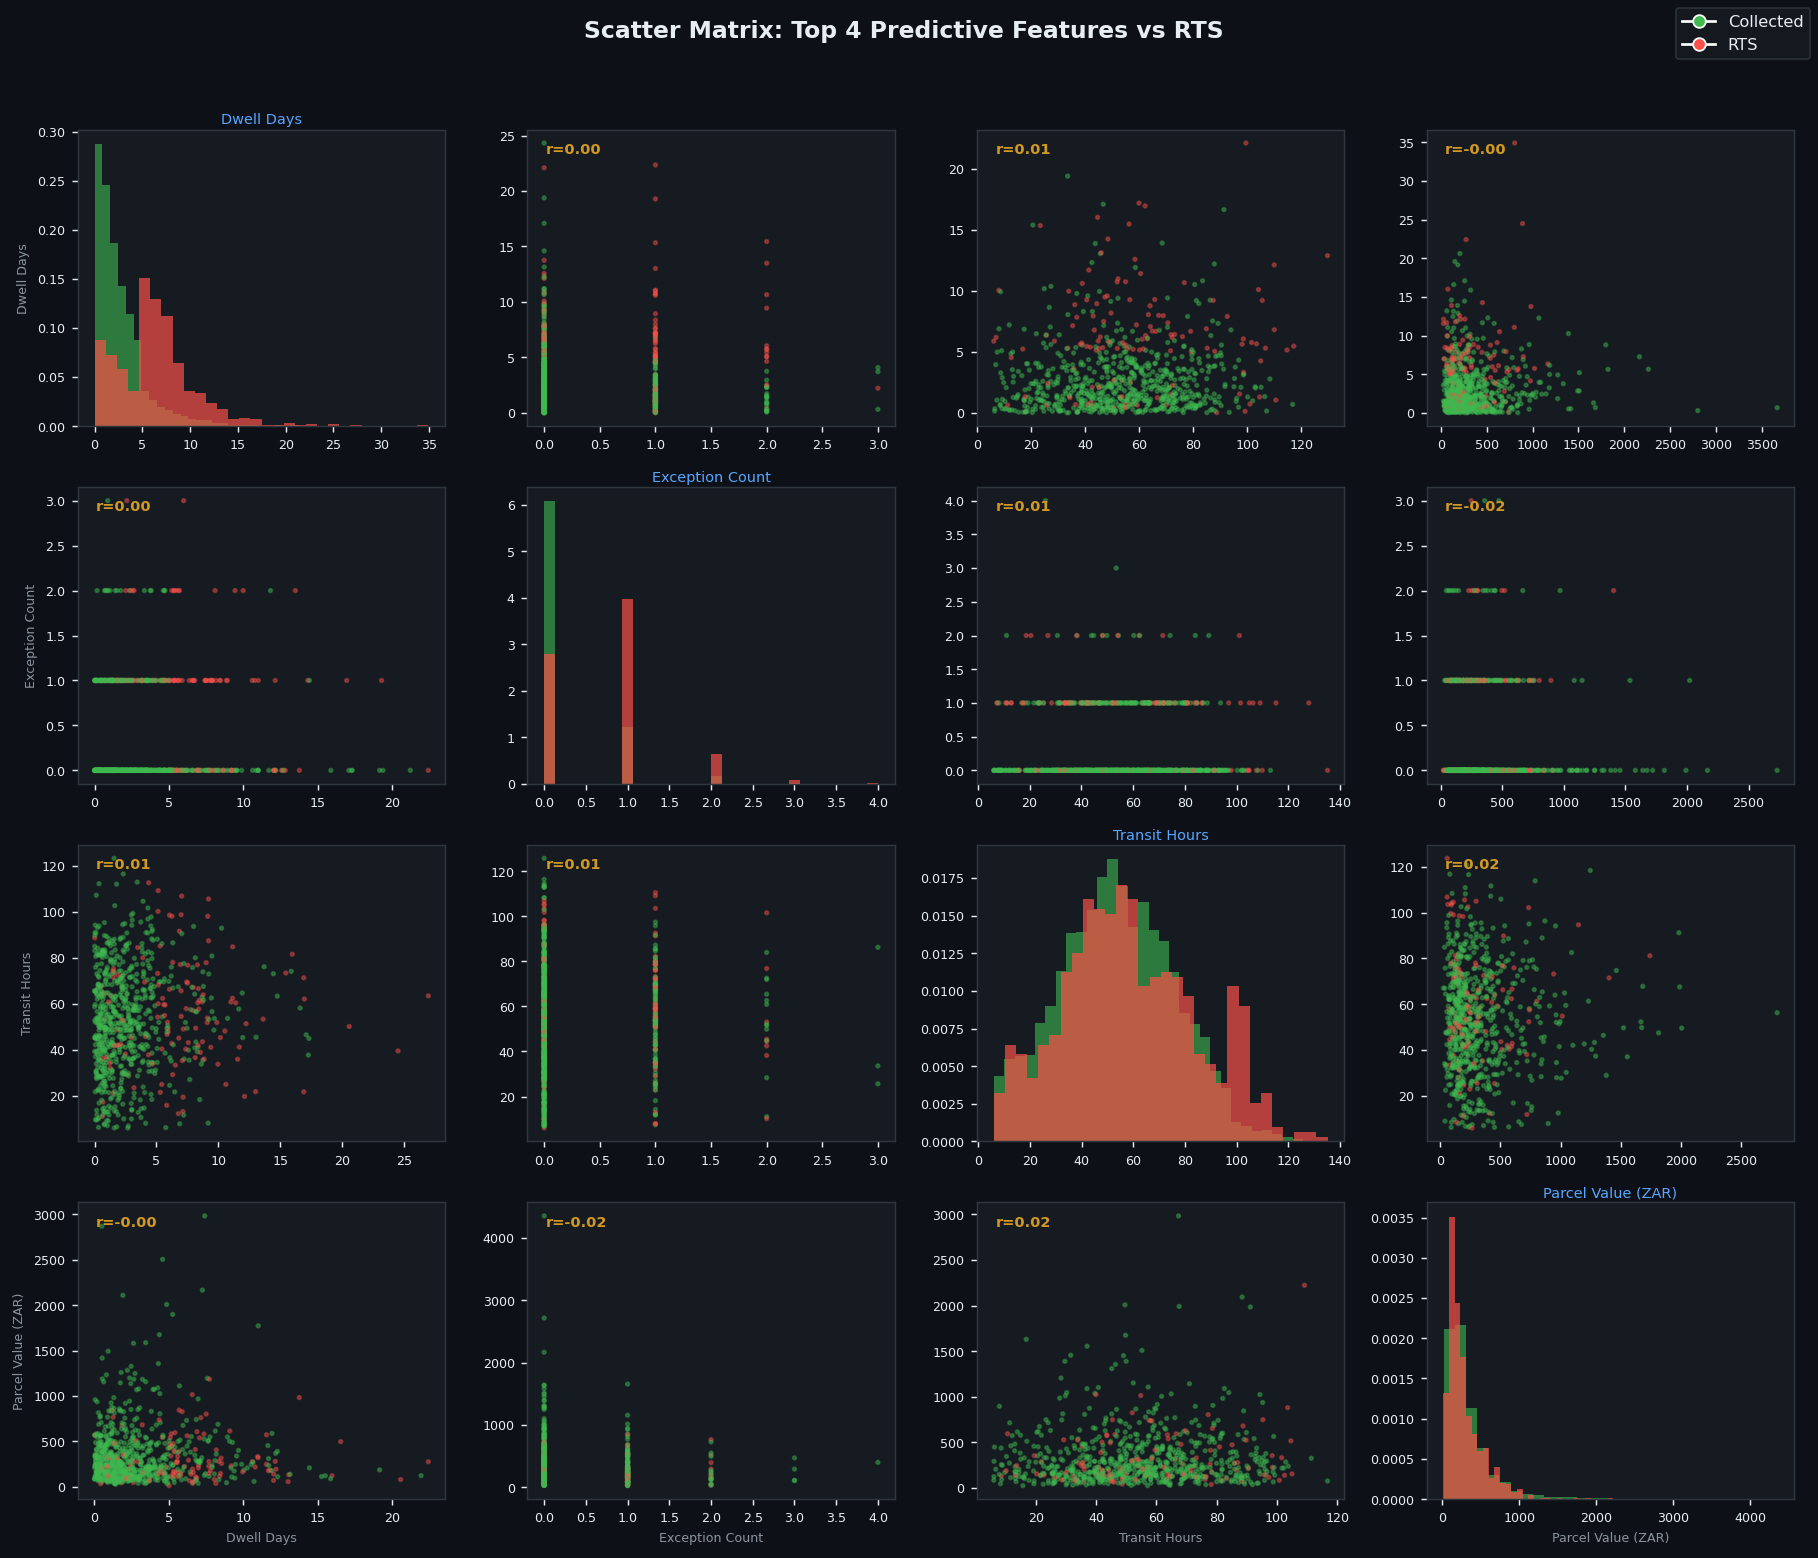
32 -- Scatter Matrix: Top 4 Predictive Features vs RTS (Collected vs RTS colour-coded)
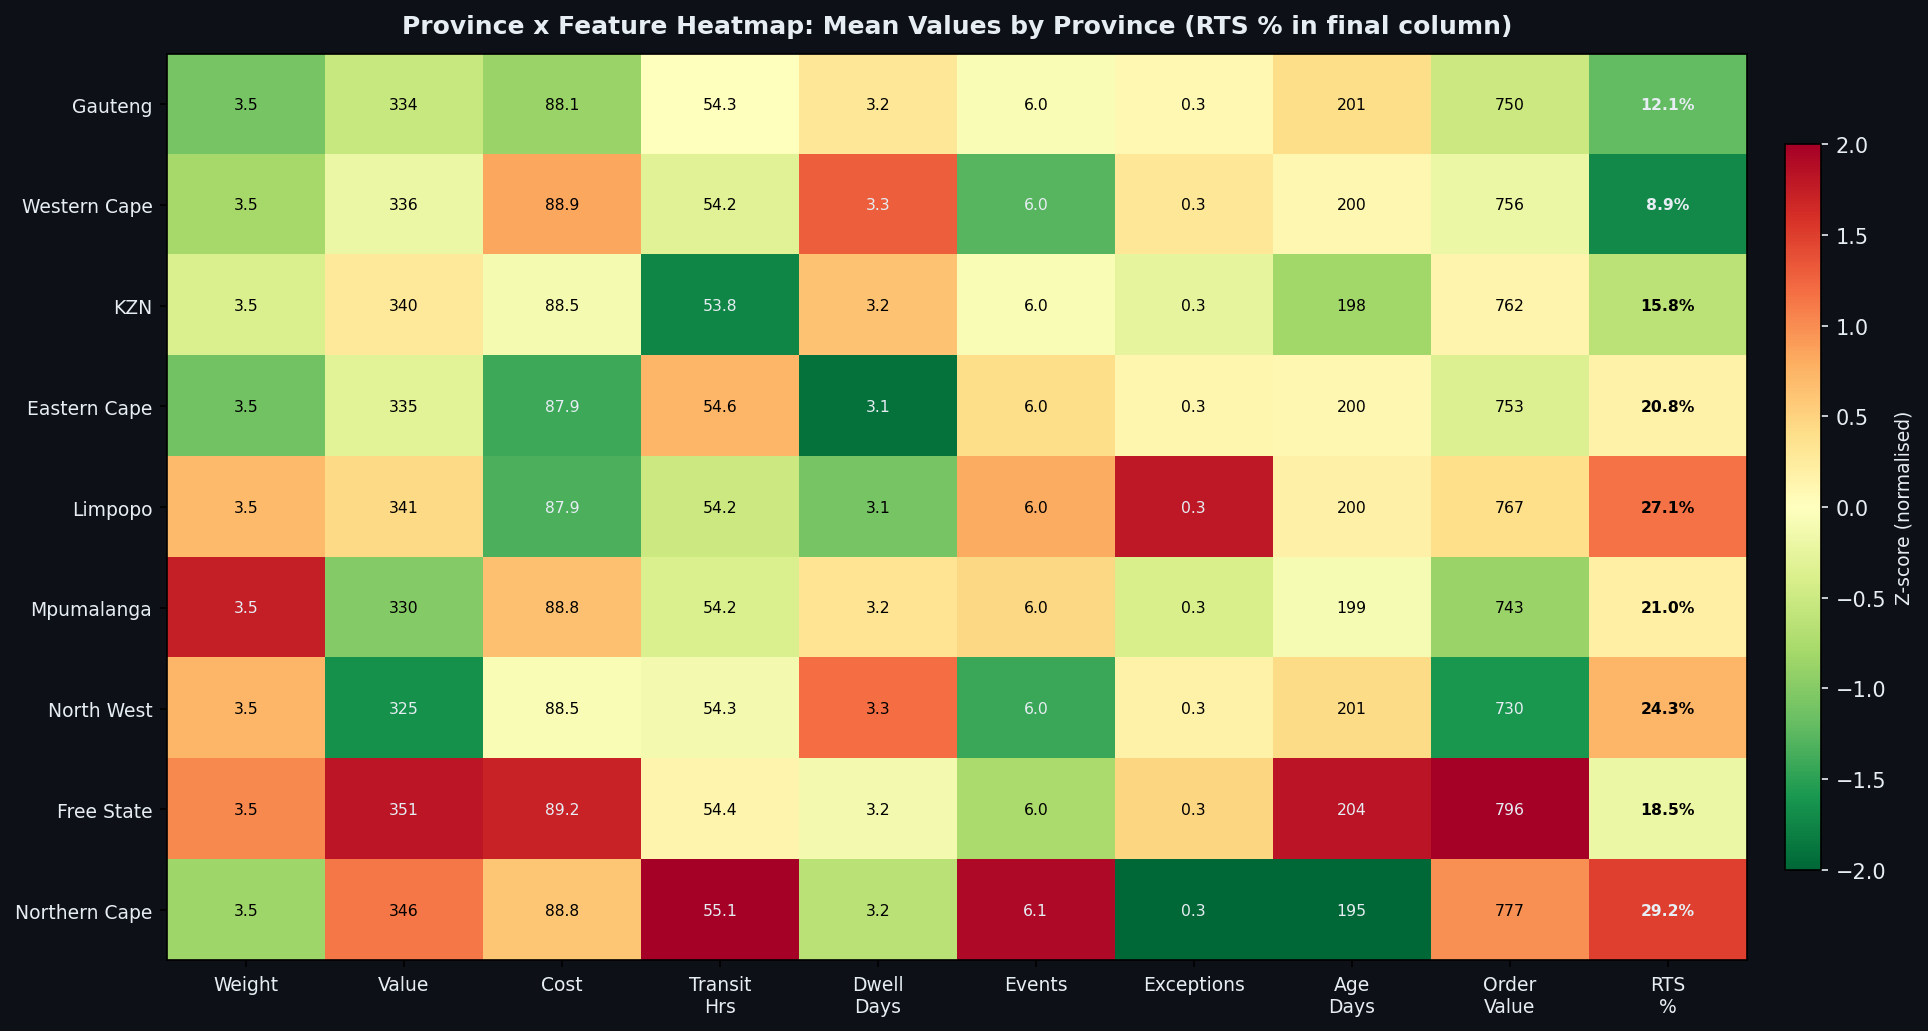
33 -- Province x Feature Heatmap: Mean values by province with RTS % column
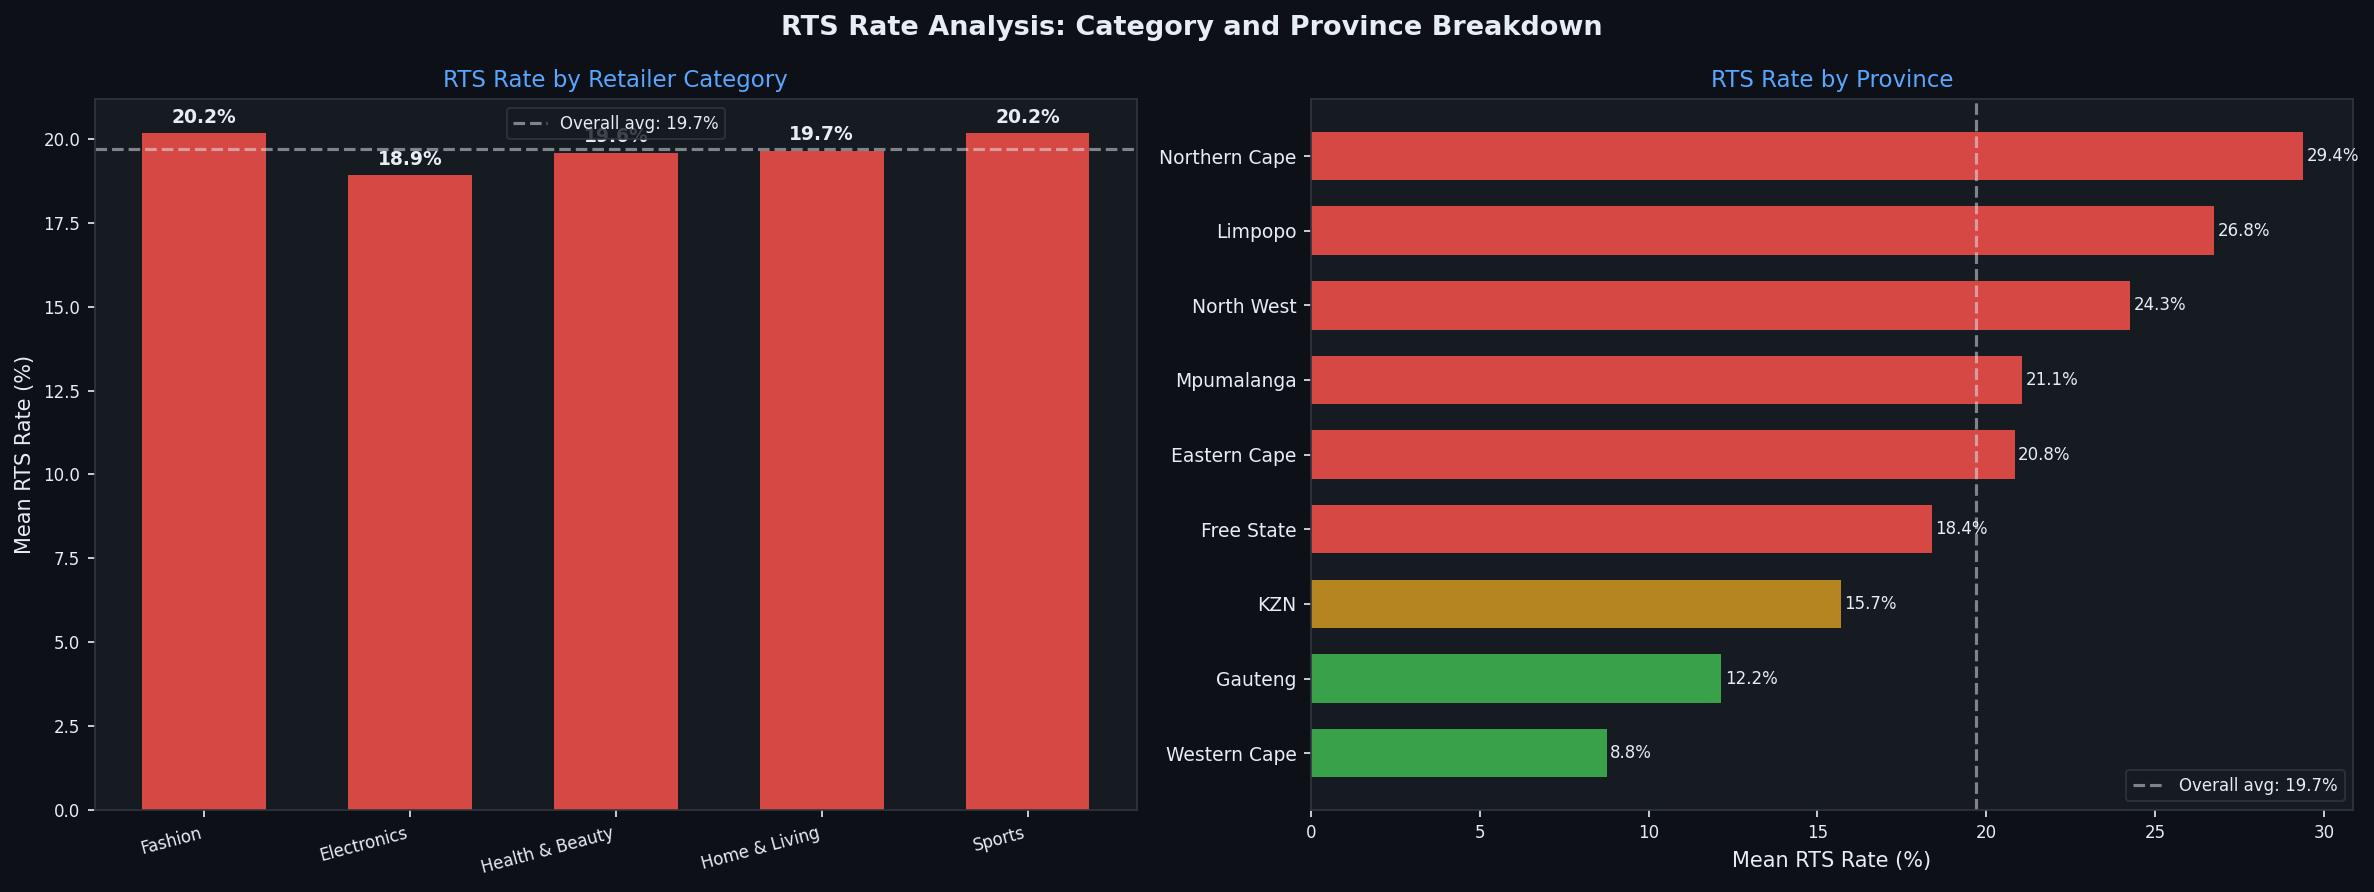
34 -- RTS Rate by Retailer Category and Province (with significance bands)
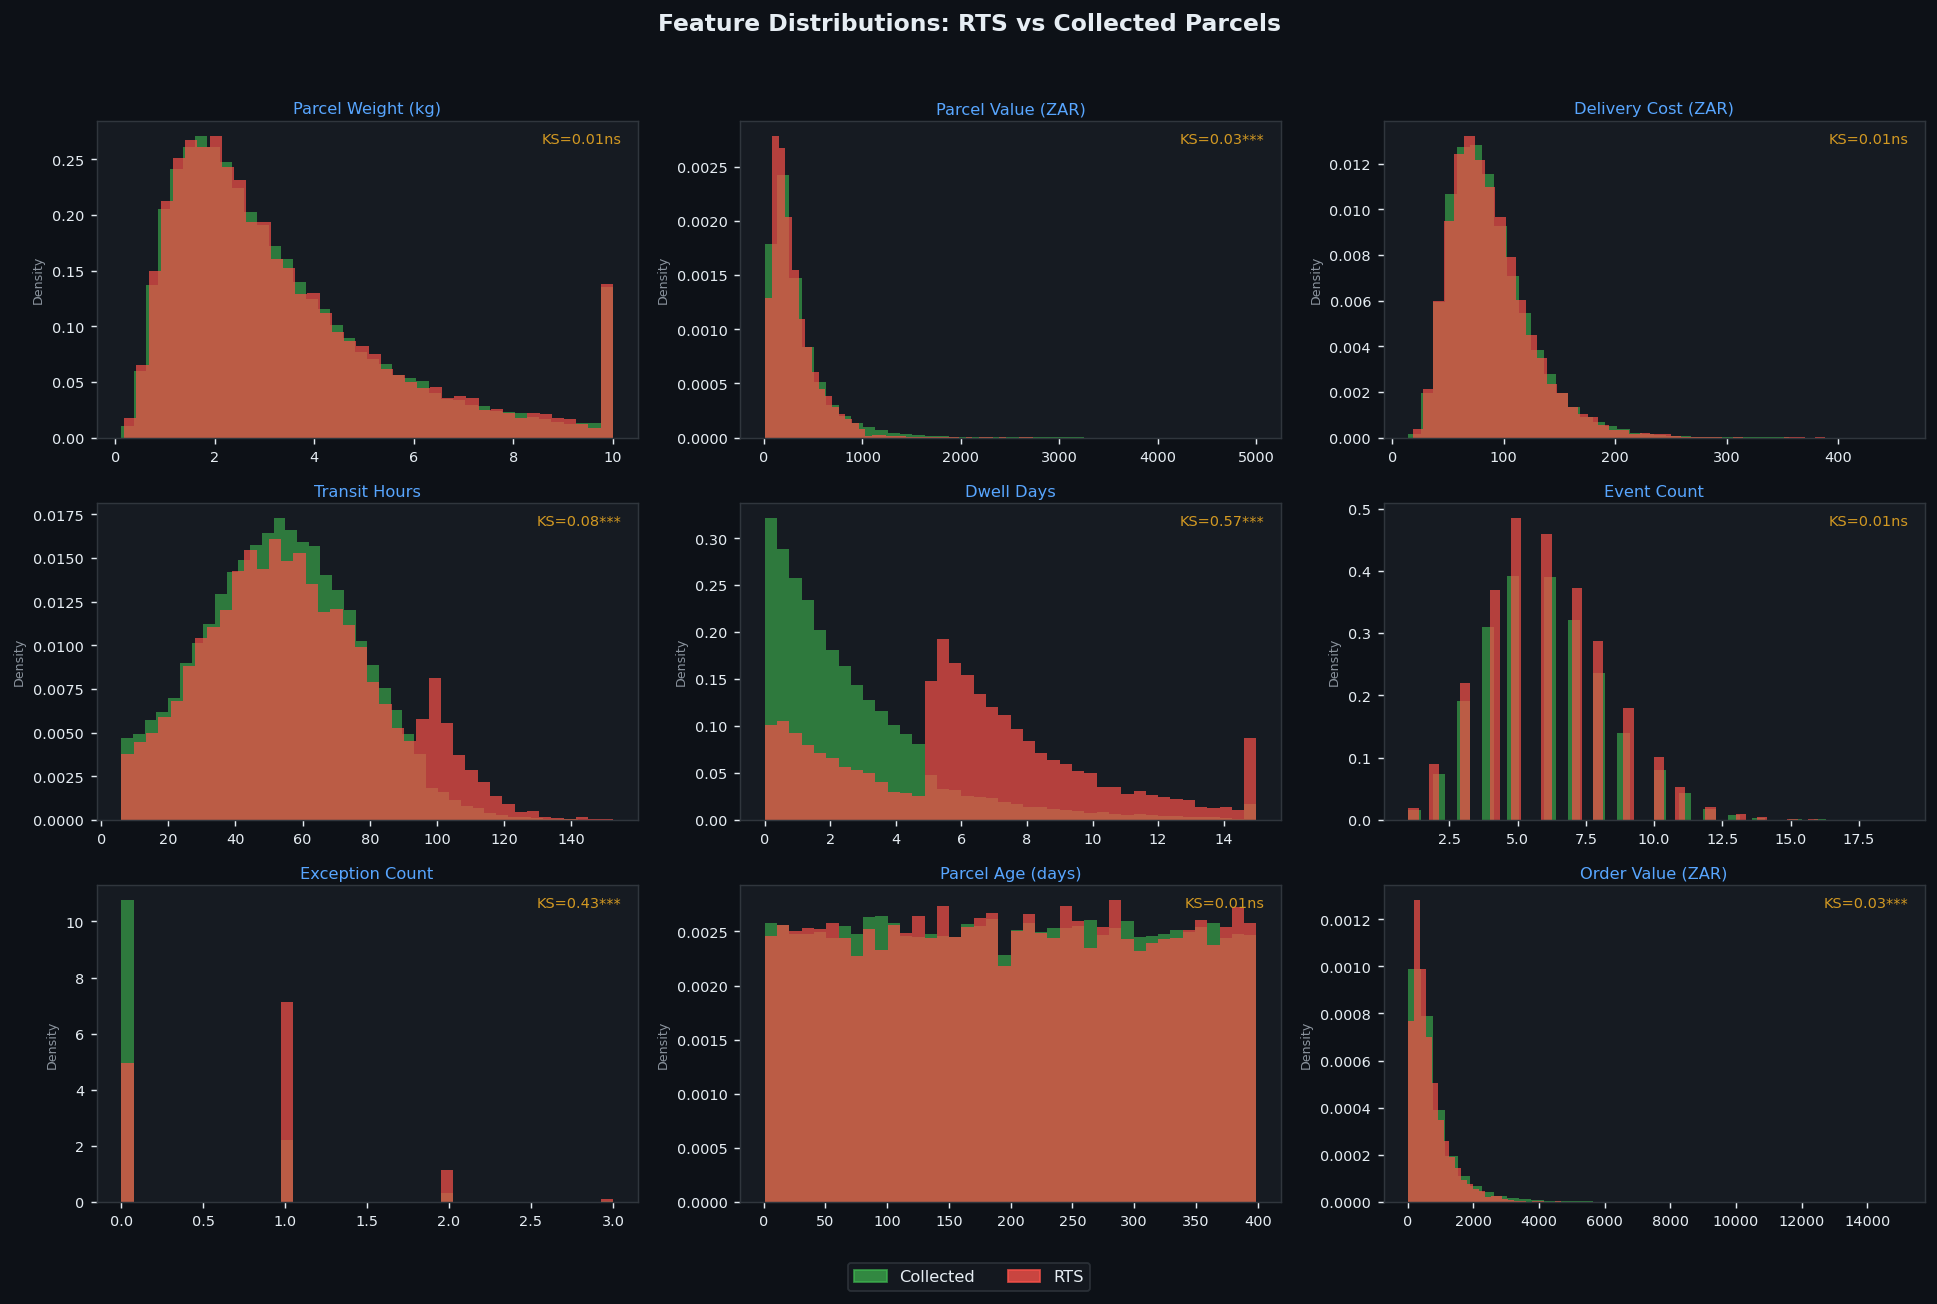
35 -- Feature Distributions: RTS vs Collected (KS test statistic per feature)
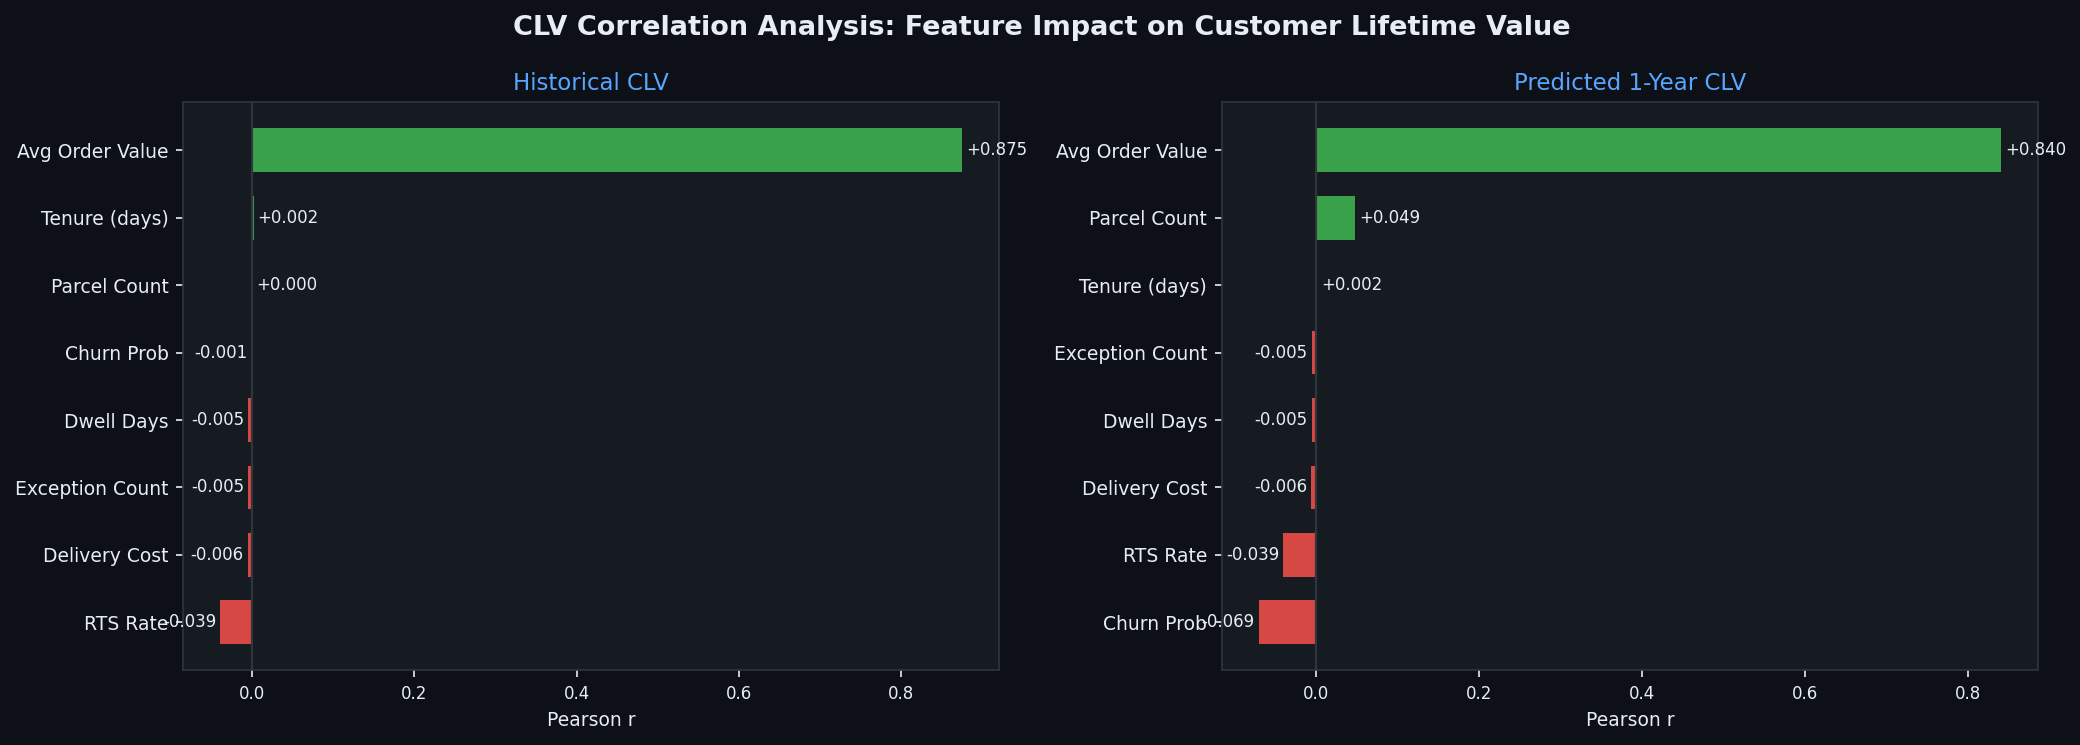
36 -- CLV Correlations: Feature impact on Historical vs Predicted 1-Year CLV
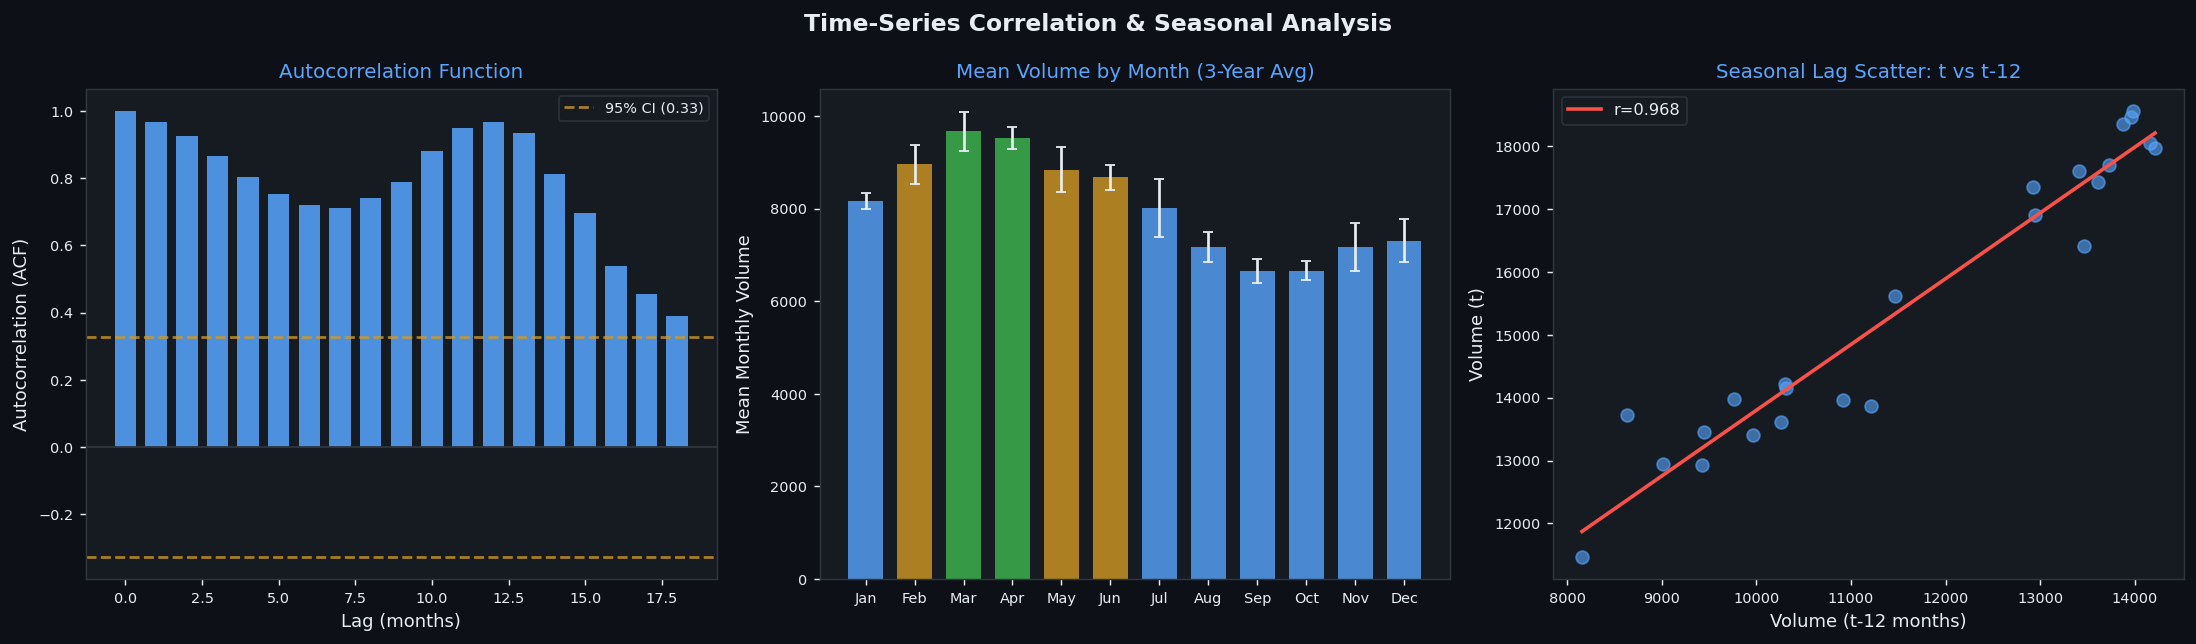
37 -- Time-Series Correlation: ACF, Seasonal Volume, Lag-12 Scatter
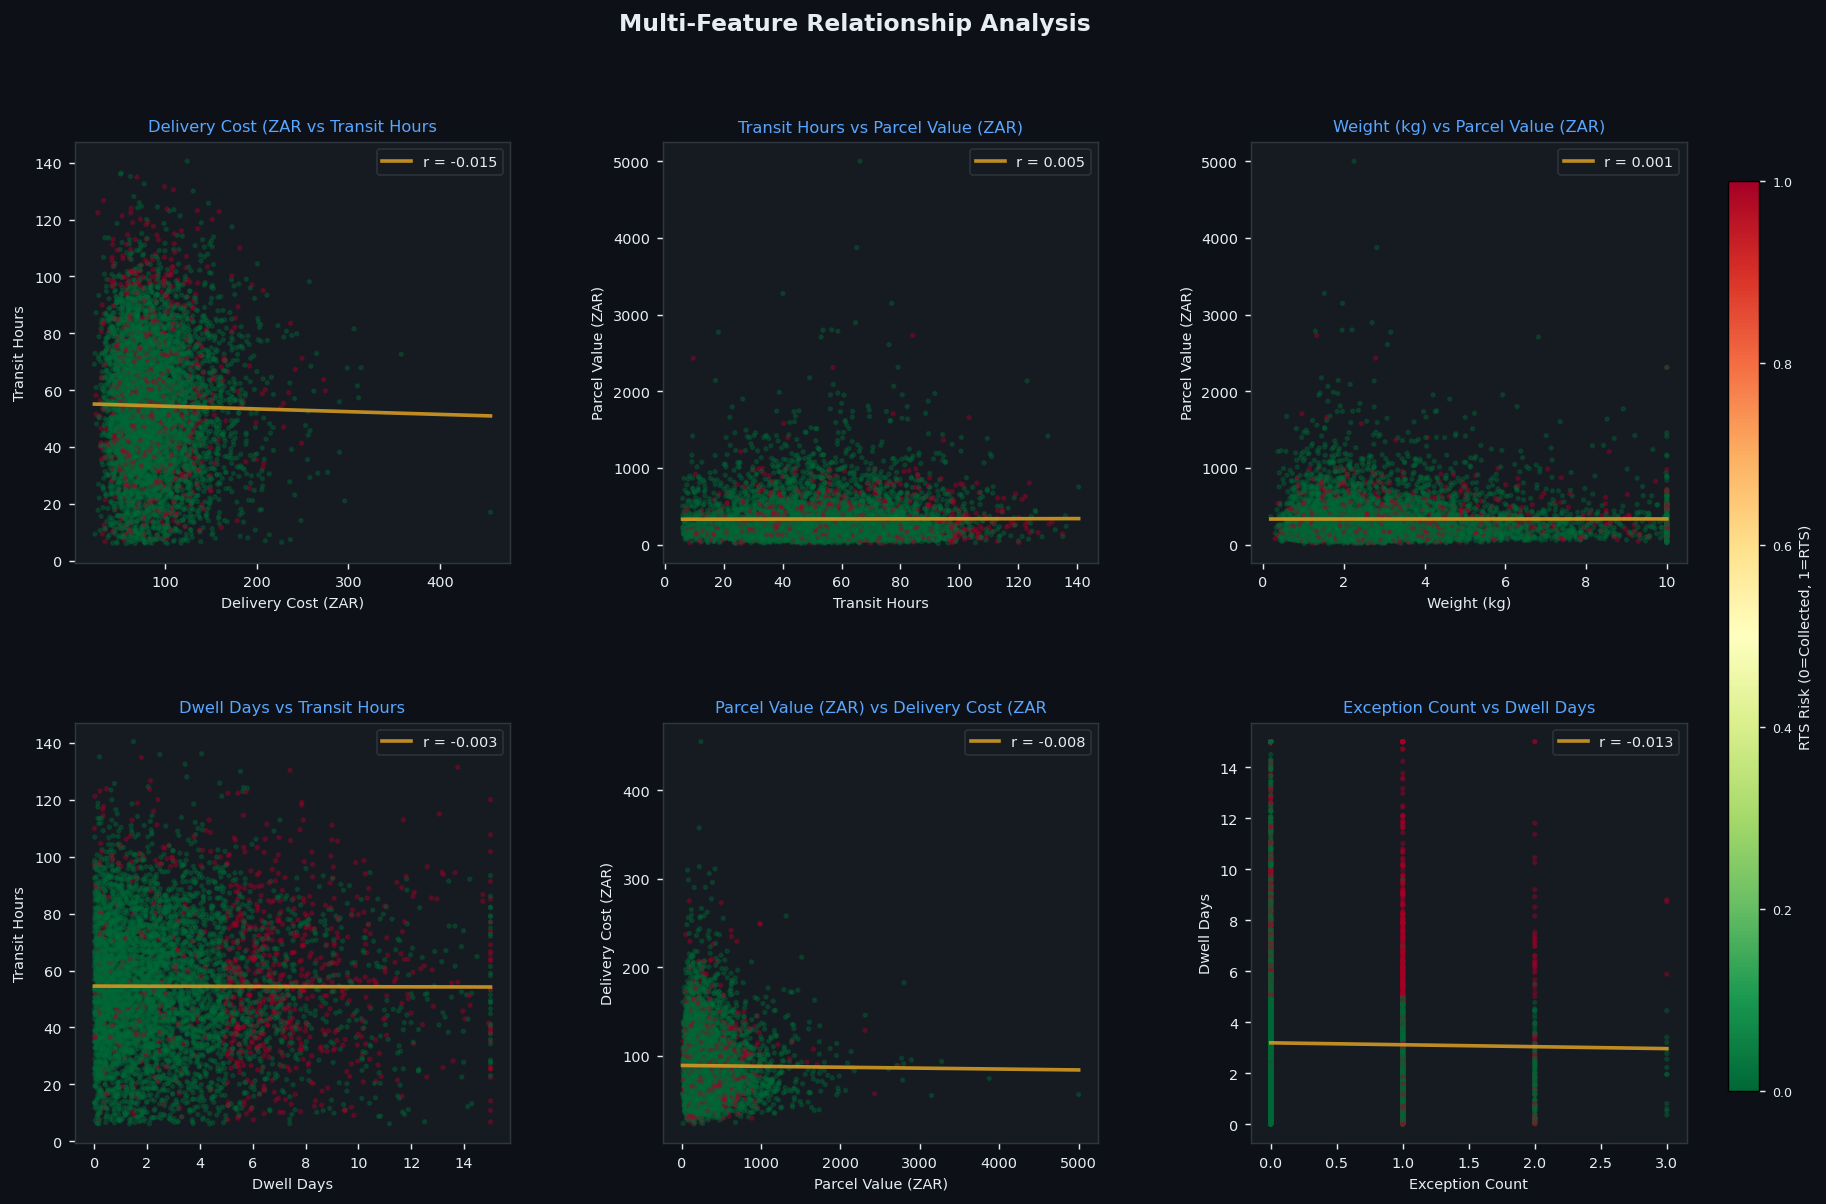
38 -- Multi-Feature Relationship Scatter Matrix (colour = RTS risk, trend line = Pearson r)
All 15 Models -- Inventory